The Gold Market From 1969 To 2011 The Bear's Eye View
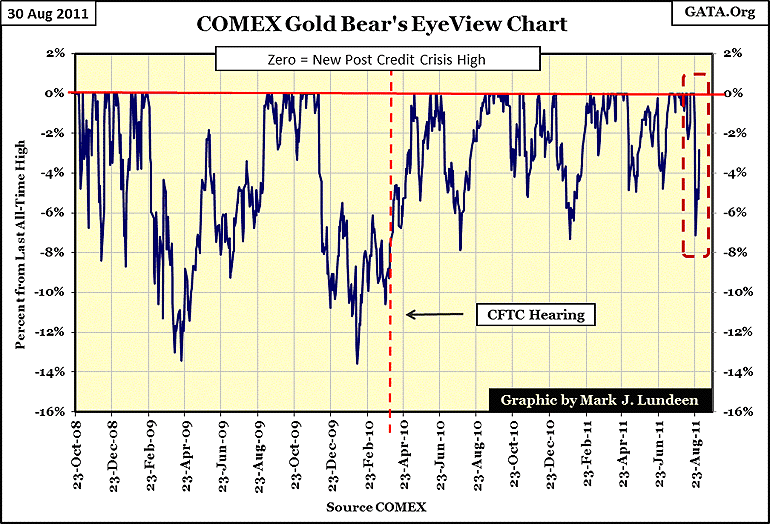
The current strength in the gold market is remarkable. Let's look at gold's Bear's Eye View (BEV) from its credit crisis low of 23 October 2008. In a BEV chart, each 0% is a new high of the series, all data points not new highs are registered as precise negative percentages from their last high of the series. So, looking at data with the Bear's Eye View, we are studying a market from the perspective of new highs, and the percentage declines from those new highs - not prices.
Since the CFTC's March 2010 public meeting on the manipulation in the silver market, gold has traded very differently. From its credit crisis lows of October 2008, to the CFTC's meeting, gold saw two 13% corrections during these 17 months, advancing 53% in price ($1092 from $713). In the 17 months following this meeting, gold saw three corrections, but none were deeper than 8% as gold advanced 73%, from $1888 from $1092.
So gold's volatility has increased, but the increase in volatility has been on the up-side.

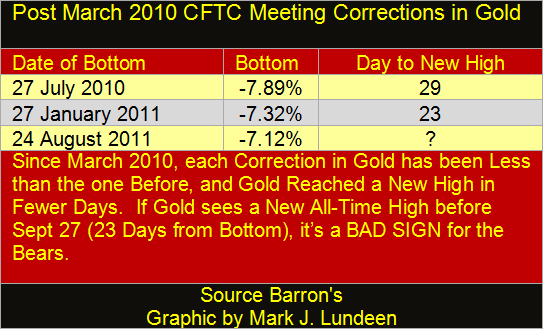
This trend of increasing up-side volatility can be seen in its current correction, red box above. From its -7.12% correction bottom, gold has risen to -2.83% in only four trading days. The BEV chart above illustrates how gold didn't recover from its other post CFTC Meeting corrections so quickly. Here is a table giving the specifics.

No doubt about it, since the CFTC's March 2010 meeting, gold has traded very differently. It will be interesting to see if gold will see a new all-time high in less than 23 days. I think it will, as the nature of this golden bull is quite different from that of the 1970s gold bull market.
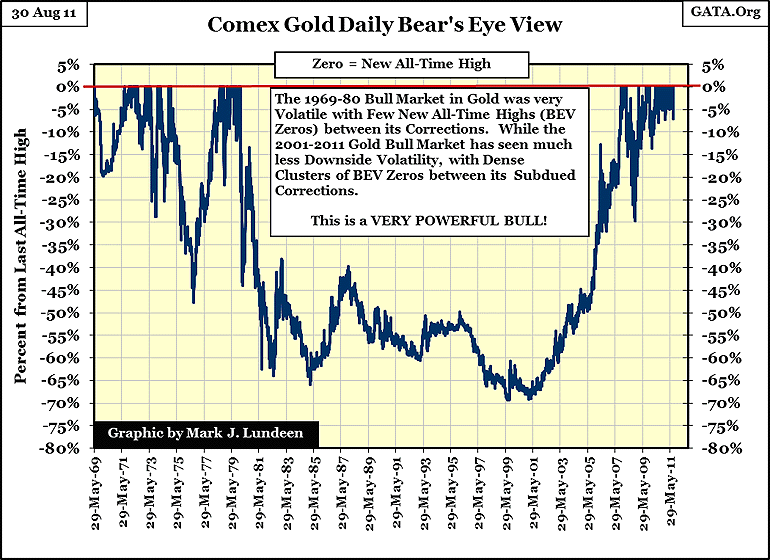
The power in the 2001-11 bull market in gold is best seen in a BEV chart covering gold since 1969. The differences between these two bull markets:
- 1969-80
- 2001-11
are dramatic!
The 1969-80 bull market in gold was actually a hair-raising experience; a rollercoaster of a bull market as is clearly evident below. I doubt many people actually took home any money during in this eleven year bull market, that saw its BEV Zeros in short clusters, with 20%, and deeper corrections as routine. What a horrible bull market to try to make money in! The following bear market in gold (1980-2001) also saw significant volatility. But remarkably, since 2001, gold's volatility has been mostly expressed to the upside.
Since the beginning of this bull market in gold, the only significant correction in the price of gold comparable to the 1969-80 bull market occurred during the 2008 credit crisis. So, to make money in our gold-bull market, all one had to do is take an * INVESTMENT POSITION * in gold, and ignore CNBC, and other sources of financial information. I admit that this is easier said than done. But had one taken this approach, they would have seen significant gains since 2001, with gold advancing higher at the end of each year.

In the above BEV plot, we see that from its October 2008 bottom, gold has built the largest cluster of BEV Zeros (new all-time highs) since the start of my data in 1969. So, when we look at the gold market as Mr Bear does, from his ability to claw back capital gains from the bulls, we see just how different these two gold bull markets are from each other. I could spend the next few days speculating why this is so. But after eleven years, all you really need to know is that this bull market is just different from the 1970's bull. Other than rising gold prices, there are few factors they have in common. This makes all predictions of what gold, or mining shares will do in the months and years ahead, based on what happened in the 1970s, exercises in futility.
For example, in the 1970s, the mining shares lead bullion prices. But what does this ancient history have to do with gold and mining shares forty years, and many trillions of dollars in debt and Federal Reserve Notes later? Absolutely NOTHING according to gold's BEV chart above! If since 2001, the mining shares have lag bullion prices, so what?
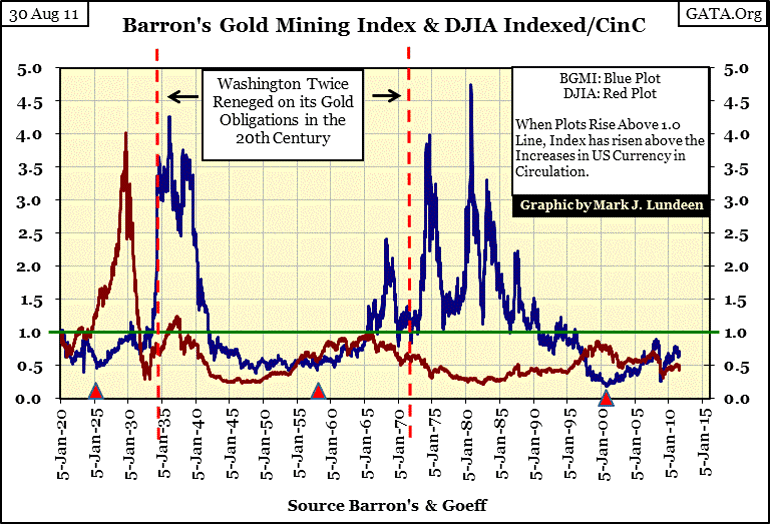
Don't worry; the miners will catch up with the metal in their own good time. Below is a comparison between the Dow Jones and the Barron's Gold Mining Index (BGMI) from 1920 to last week. I indexed these series to 1.00 = 05 January 1920, and then made the their plots ratios by dividing each with US Currency in Circulation (CinC). Who knows that since 2000, the gold miners have outperformed the Dow Jones in inflationary terms? Well you do now! Also, historically it takes a while for the gold and silver miners to catch on fire. I placed a little triangle below the starts of the other significant bull markets in the BGMI to prove this point. These things just take time to play out, that makes today's mining shares real bargains. If history is any guide to the future, and it usually is, the persevering mining share investor will be amply rewarded before this bull market in precious metals is over.

The important point to make of all this is that gold's BEV chart provides us with a fair comparison of the two bull markets it has seen since 1969, as well as the 70% bear market that separates them. Since 2001, gold hasn't pussy-footed around! Gold has been going up with the purpose of reclaiming its rightful place in the affairs of mankind; as the check on the ambitions and schemes of the "best-and-the-brightest" in banking, academia, and government. All the people who think they can control the world, not with their virtues, but with their paper-money, social theories, and power of regulation. These people have made quite a mess of our world, so short gold and the mining shares at your own risk in this market!
[email protected]


