Gold Market Trends: 2 Interesting Charts
 share
share
 share
share
 share
share
 share
share
 share
share
Something changed in the minds of investors in 2008 as more individuals switched to buying physical gold bullion. How much more physical gold buying has taken place since 2008 can be seen in the two charts below.
Gold jewelry and physical retail investment are the largest demand segments of the gold market. In 2000, the world consumed 3,187 metric tons (mt) of gold jewelry compared to a paltry 156 mt of physical gold investment. Thus, physical gold investment was only 5% of these two markets in 2000.
However, if we look at the first chart below, we can see how the trends of these two markets changed over the next decade and a half:
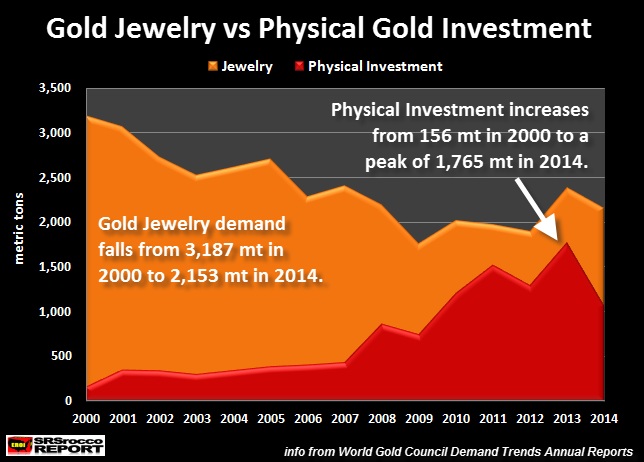
Global gold jewelry fell from 3,187 mt in 2000, to 2,153 mt in 2014. On the other hand, physical gold investment demand increased from 156 mt in 2000, to a peak of 1,765 mt in 2013. Basically, gold jewelry demand declined 32% since 2000, whereas physical gold investment increased more than 1000% at its peak in 2013. Even if we include the drop of physical gold investment to 1,064 mt in 2014, it is still nearly seven times more than it was in 2000.
If we break down gold jewelry and physical investment into two periods, we have the following chart:
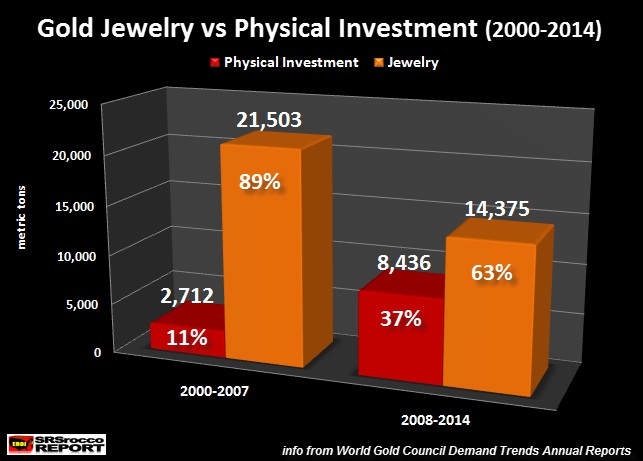
Total physical gold investment demand from 2000-2007 was 2,712 mt, compared to a stunning 21,503 mt of gold jewelry demand. During this time period, physical gold investment was only 11% versus 89% of gold jewelry demand.
This all changed in 2008 as the U.S. and World were experiencing a meltdown of its banking and stock markets. Thus, total physical gold investment demand increased more than three times to 8,436 mt and now accounted for 37% of the mix compared to gold jewelry demand of 14,375 mt at 63%.
If we convert these metric ton figures to troy ounces, here is the result:
Physical Gold Investment vs Gold Jewelry Demand (million oz – Moz)
2000-2007 Physical Investment = 87 Moz
2000-2007 Jewelry Demand = 691 Moz
2008-2014 Physical Investment = 271 Moz
2008-2014 Jewelry Demand = 462 Moz
Furthermore, if we consider present gold demand (2014: physical gold investment of 1,064 mt vs 2,153 mt gold jewelry), the world is now buying (1) ounce of physical gold investment for every (2) ounces of jewelry demand compared to (1) ounce of physical gold investment versus (20) ounces of gold jewelry in 2000.
Which means, individuals are now buying physical gold investment compared to gold jewelry at a rate ten times higher than they were 15 years ago. That is an amazing statistic, and it goes to show that investors increasing rather buy gold as an investment rather than for adornment purposes.
Of course, India (and China to lesser extent) view gold jewelry as a form of wealth, rather than something fashionable to wear around one’s neck, wrist or finger. So, we could actually take a good percentage of total gold jewelry demand and place it into physical investment demand.
These two charts show that investors have increasingly switched to buying more physical gold investment rather than gold jewelry… especially since 2008. As conditions in the world’s bond and stock markets continue to weaken, I would imagine we will see physical gold investment surpass gold jewelry demand for the first time in recent history.
Lastly, this will likely occur when the value of gold will change from a commodity pricing mechanism (supply-demand & cost) to a store of wealth due to the collapse in value of most paper and physical assets in the future.
********
Please check back for new articles and updates at the SRSrocco Report. You can also follow us at Twitter below:

share
share
share
share
share

Independent researcher Steve St. Angelo (SRSrocco) started to invest in precious metals in 2002. Later on in 2008, he began researching areas of the gold and silver market that, curiously, the majority of the precious metal analyst community have left unexplored. These areas include how energy and the falling EROI – Energy Returned On Invested – stand to impact the mining industry, precious metals, paper assets, and the overall economy. He has written scholarly articles in some of the top precious metals and financial websites. Visit his website SRSrocco Report.