Gold Market Update
In the last update posted on the 15th January gold was expected to consolidate rather than react, but instead it got taken down temporarily by the near crash conditions that then rapidly developed across most markets. However, gold’s great strength and resilience at this time is amply demonstrated by the fact that it has since rebounded strongly and is back at its pre-panic highs - and the dramatic developments of the past week, most notably the Fed’s big rate cut, have greatly strengthened the bullish case for gold. The breakdown in US stockmarkets was expected and predicted on www.clivemaund.com although it was not thought that it would have any net negative impact on gold, and that has so far proved to be the case, despite the brief plunge in sympathy with collapsing markets.
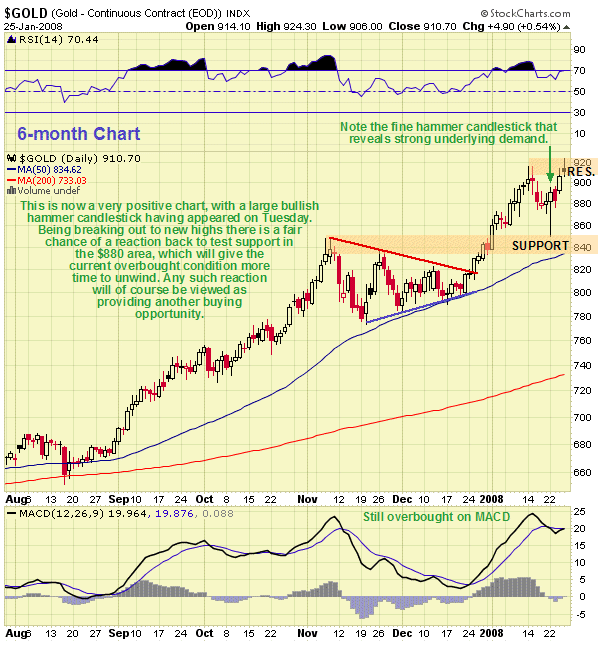
On the 6-month gold chart we can see the strong uptrend that developed following the breakout from the fine Symmetrical Triangle consolidation pattern in mid-December, this rally being called the day before it started. The uptrend resulted in gold becoming very overbought by the middle of this month, when consolidation was expected, but instead, as a result of the global market meltdown, it reacted. Nevertheless, as we can see, it has held up remarkably well and at this point has recouped all its losses. Although gold plunged intraday last Tuesday, it actually ended the day well up, leaving behind a giant “hammer” candlestick on its chart - a VERY bullish omen.
Any fool knows that falling interest rates are good for investments that pay no interest, such as gold, as on an opportunity cost basis it makes them more attractive, so the Fed’s huge panic rate cut last week was clearly great news for gold and silver. One would have thought though that this move would have caused the dollar to plunge, but so far at least it hasn’t happened - why is this? One big reason is that other trading blocs, most notably the European Union, are going to be arm-twisted into dropping their interest rates too, so that the battle to defend the crumbling ramparts of the doomed castle can continue along all of its ramparts, presumably to the tune of Tom Lehrer’s old song We will all go together when we go. This brings us to a crucially important point. The Fed’s massive three-quarter point rate cut last week, along with implied rate cuts elsewhere before much longer, notably the European Union, represents a sea change in the fortunes of gold and silver and not just for the obvious reason that they are suddenly much more competitive investments. The swingeing rate cuts demonstrate that politicians and central banks are going to respond to the crisis by throwing gasoline on the fire. Why is this - why won’t they grasp the nettle and deal with the problems head on in an honest way? The answer is simple - the problems caused by years of financial impropriety are so massive, so deep-rooted and intractable, that any serious attempt to deal with them at a core level would result in total economic implosion and collapse, so the name of the game is procrastination. Collapse is inevitable but as politicians and business leaders want to hang on to their power and influence for as long as possible, they will do everything to put it off as much as they can. What this means is that the ever-threatening credit crunch will be held at arm’s length for as long as possible by continual huge injections of liquidity. How do they create this liquidity? - the money is created from nothing with a few simple keystrokes. So the prospect is for a huge ramping of the money supply worldwide. More money chasing the same quantity of goods and services equals more inflation. If you think that money supply growth at 10 to 12 % is high come back in a year or two and see what it’s like. So the prospect is for rampant inflation and in some cases hyperinflation leading to the inevitable greatest financial train wreck of all time, when the whole rotted out edifice collapses and all the worthless junk that has been and is being misguidedly hoarded - credit, derivatives, Treasury bonds, US dollars etc - is finally seen for what it is - garbage, with no intrinsic value. That’s when the shift to investments with real value will rapidly turn into a stampede - pedants will drive up the prices of paintings and stamps etc, which will need to be securely locked up, but the jewels in the crown of “intrinsic” investments will be gold and silver. The process may already have started - the system is visibly coming apart at the seams.
The “sea change” referred to in the above paragraph is this: gold and silver investors should not now be so obsessed with the course of the dollar. This is because last week’s action by the Fed and what it will lead to elsewhere mean that global money supply growth is set to expand at an exponentially rapid rate. Thus we should see gold and silver rising strongly against most currencies going forward. This is the reason why we have looked at gold and silver charted in Euros in recent Gold Market updates.
We will look once again at the 6-month gold chart to consider the immediate outlook. After the recovery late last week we can see that gold is still substantially overbought on an intermediate basis, as made clear by the MACD indicator at the bottom of the chart, having risen by no less than $60 from its intraday low on Tuesday. Now observe how yesterday the price made a new intraday high, but closed below the pre-panic intraday highs. This action suggests that we are likely to see a reaction early next week before further upside progress is made, and it is thought likely that the reaction will take it back to test support in the $880 area. Should such a reaction occur, it will be viewed as providing another buying opportunity.
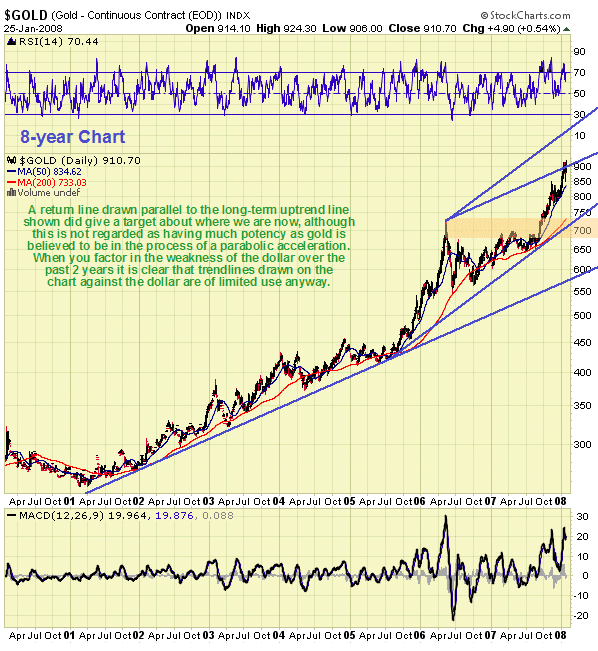
It has been suggested that gold’s recent uptrend ended where it did because it had reached the return line of a parallel channel drawn from the low late in 2001, very early on in the bullmarket. Although this may be so, this return line is ascribed limited potency, because everything points to gold being in the early stages of a long period of parabolic acceleration - and in any case trendlines (and support and resistance levels) drawn on the dollar chart are viewed as having decreasing relevancy because of its weakness. It is better to look for them on comparative bedrock currencies such as the Euro or Swiss Franc.
Finally, in attempting to figure a target for gold, or rather a point to take profits after the next powerful uptrend, we are planning on using the targets on the long-term silver chart shown in the Silver Market update. Although silver’s strongest gains should occur in the later stages of gold’s advance, they should both top out together, as usual.
Silver Market Update
Clive Maund
With silver currently moving almost in lockstep with gold, it is clear that many of the bullish arguments for gold apply equally well to silver, so they will not be repeated here. Rather, after a brief review of recent action on the 6-month silver chart, we will look once again at the inspiring long-term chart for silver, on which we can determine a target for a strong silver advance, which will help in determining when gold will next top out, as even though silver is likely to advance strongly as gold’s advance is decelerating, they should both top out more or less together, as usual.
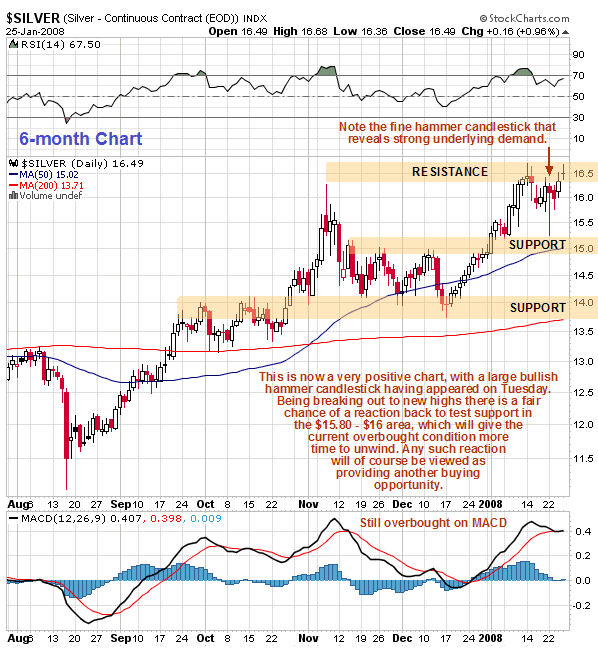
On the 6-month chart we can see how silver plunged intraday on Tuesday, along with just about everything else, only to close near the high for the day, leaving behind a fine strongly bullish hammer on the chart. Since that day of panic and recovery it has crept still higher, and yesterday tested the resistance at the pre-panic highs. Given that it has risen by about $1.25 from its Tuesday intraday low, and that it is still overbought following its strong run from mid-December, as made clear by the MACD indicator at the bottom of the chart, a near-term reaction back from the resistance at the highs looks likely next week ahead of an advance to new highs. Thus it is considered probable that it will react back to the $15.80 - $16.00 area short-term, with any such reaction being viewed as a buying opportunity.
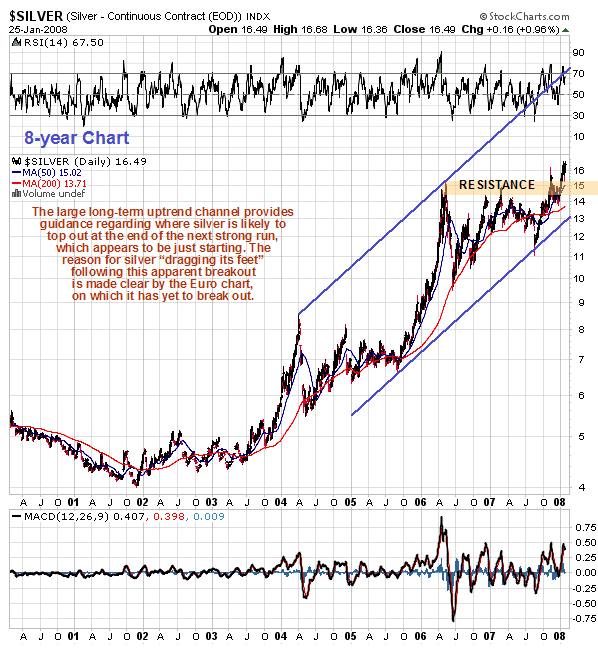
On the long-term 8-year chart we can see that silver is now just breaking out from a massive 20-month consolidation pattern to embark on another major uptrend. If it follows a similar trajectory to the powerful 2005 - 2006 uptrend, which is actually a modest expectation given the fundamental background, then $28 - $30 may be attained within 6 months or so.
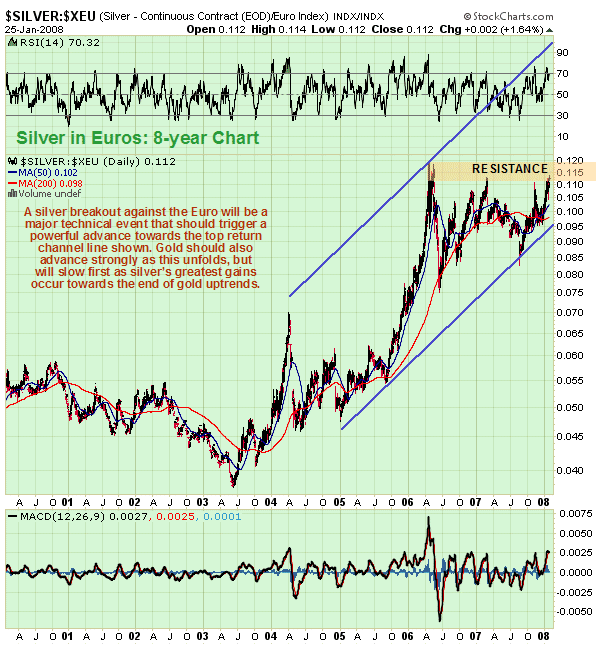
The reason for silver seemingly having trouble rising away from its long consolidation pattern is quickly made clear by glancing at a chart for the same 8-year timeframe of silver plotted against the Euro, where it can be seen that silver has yet to break out in Euros. Thus, it is should be clear that once silver breaks out against the Euro, and against other important currencies such as the Swiss Franc, the advance can be expected to accelerate dramatically.
Clive Maund, Diploma Technical Analysis
Copiapo, Chile, 25 January 2008


