Gold Market Update
 share
share
 share
share
 share
share
 share
share
 share
share
 In order to comprehend why the long-term outlook for gold (and silver) is so positive, you only have to understand that global debt and balance sheets are set to expand indefinitely. The controllers of the system had the chance to demand that the books be balanced back in the financial crisis of 2008 - 2009, but they weren’t interested – they were much more interested in taking the easy way out and lining their own pockets at the expense of society at large, by printing vast quantities of money which they gifted to themselves, and fleecing savers via zero and now negative interest rates. They were then able to use their Central Bank generated cash handouts to make even more money by speculating in global property and stock markets, and magnify their gains even more via the carry trade. In the past they would have been sent to prison for a long time for this, but since they control society they can make and amend laws to suit themselves, and with respect to themselves the laws are unenforceable anyway, and the ordinary population, who have been neutered, are going to stand up to them.
Wouldn’t you like to get your hands on some of this?
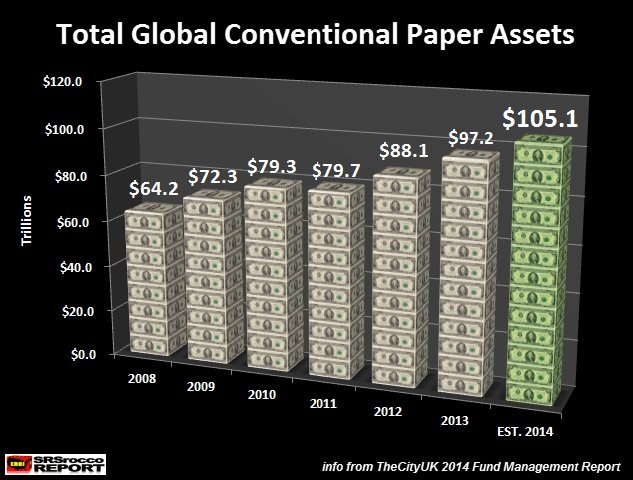
There is now no going back – the debt and derivatives bubbles etc have now expanded to such a degree that any attempt to normalize the system by draining liquidity would lead very quickly to a severe credit crunch involving a dramatic spike in interest rates leading quickly to a systemic implosion. The name of the game therefore is to keep the balls in the air for as long as possible until the whole rotten structure collapses in a smoldering heap. The signs of systemic exhaustion are everywhere as the increasingly futile attempt to keep deflationary forces at bay by means of printing trillions upon trillions on new currency have less and less effect on economies. Southern European economies have already been laid waste by deflation – and EU leaders have only just “wised up” and opened the quick fix monetary spigots.
In light of all this you would think that gold and silver would be going through the roof already, but investors are too busy chasing rainbows in the broad stock market and trying to catch the late stages of various property bubbles etc, and in so doing become the bag holders of the Big Money who will be selling out to them and buying gold and silver on the cheap before they lift off, and probably already are.
We have already observed in the past the similarities between the bull market in gold and silver of the 1970’s and the current one – “What bull market?” I hear you ask – gold’s in a bear market isn’t it? – that’s right it is, but this bear market is nested in what is believed to be a larger secular bull market that should eventually dwarf the one of the 1970’s. More senior readers may recall how the great bull market of the 70’s paused for a nasty deep correction in 1975 – 1976 that looked like a bear market at the time, like the current nasty prolonged correction, and how it was eventually followed by a new uptrend and new highs that lead into the spectacular parabolic blow-off late in the decade, when silver went nuts.
In terms of the amount of fuel for the coming gold and silver bubble, which is the amount of currency debt and monetary excess already existing, not to mention that to come, there is no comparison with the 1970’s. The amount of excess debt and derivatives is now astronomic, so that it dwarfs anything created in the 70’s – it is like comparing a box of matches to a truckload of nitroglycerine. It therefore follows that the resulting bubble in gold and silver will dwarf that which occurred in the 1970’s.
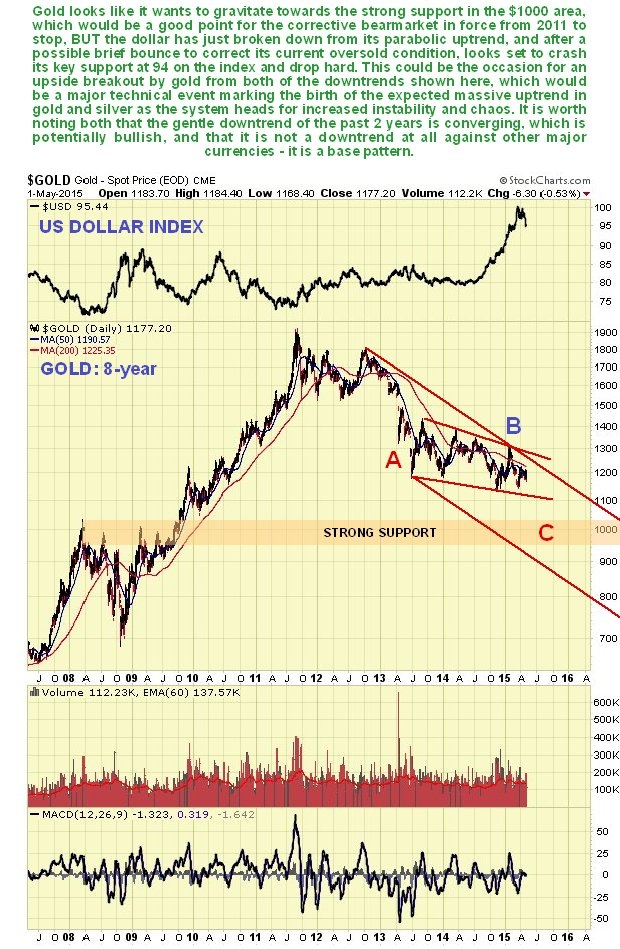
Now let’s look at the charts in an effort to gauge the short and medium-term outlook. Starting with the 8-year chart for gold we can see that there remains some risk of it gravitating towards the strong support in the $1000 area before the big corrective phase is over. However, with the dollar breaking down that risk is easing, and the chances of an upside breakout from the downtrend are improving. Within the big downtrend channel from the highs we can see a much less steep channel which the price has been stuck in for almost 2 years. This channel is showing some convergence, which is a positive sign. Watch for a breakout from both of these channels which would signal the birth of a major new uptrend, but until that happens there is some risk of a further drop to the strong support in the $1000 area. A point worth keeping in mind is that gold of course looks a lot better when charted against most other currencies.
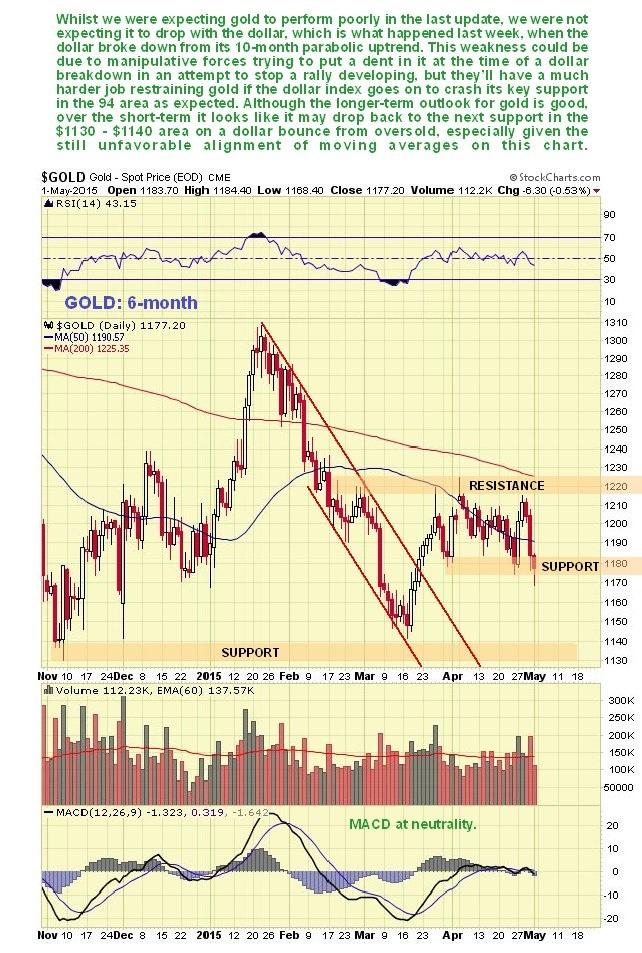
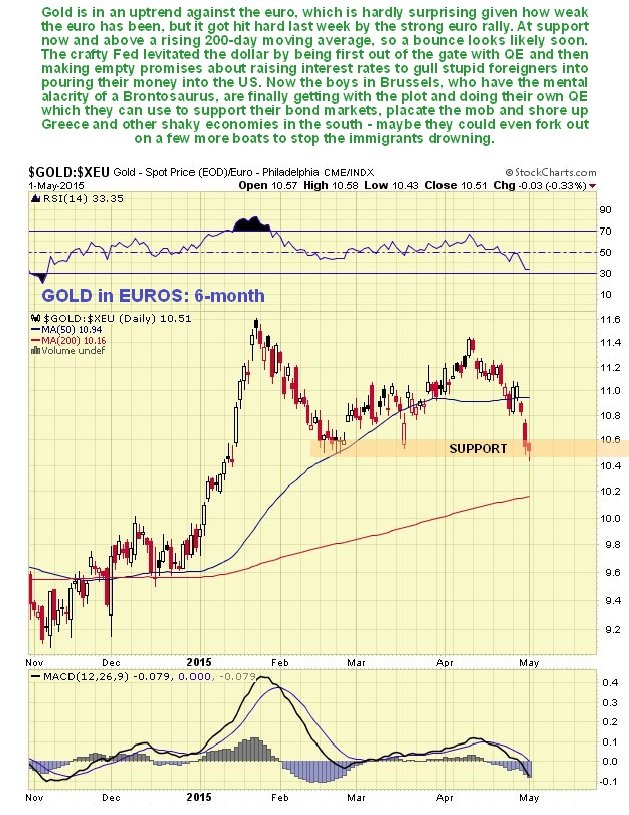
The short-term 6-month chart for gold continues to look negative with moving averages in bearish alignment. Gold performed surprisingly poorly last week when the dollar broke down from its parabolic uptrend and now looks vulnerable to a near-term decline to its next support level in the $1130 - $1140 area. However, the market doesn’t appear to have grasped the significance of the failure of the dollar’s parabolic uptrend – but it will once the dollar index crashes its support in the 94 area and drops hard. So after an initial decline on the expected weak dollar bounce, gold could turn sharply higher on the dollar crashing its key support, bearish moving average alignment or not.
Gold actually looks impressive on its euro chart, but of course this is not saying much considering what has happened to the euro in recent months. More importantly it looks good vis-a-vis other major currencies…
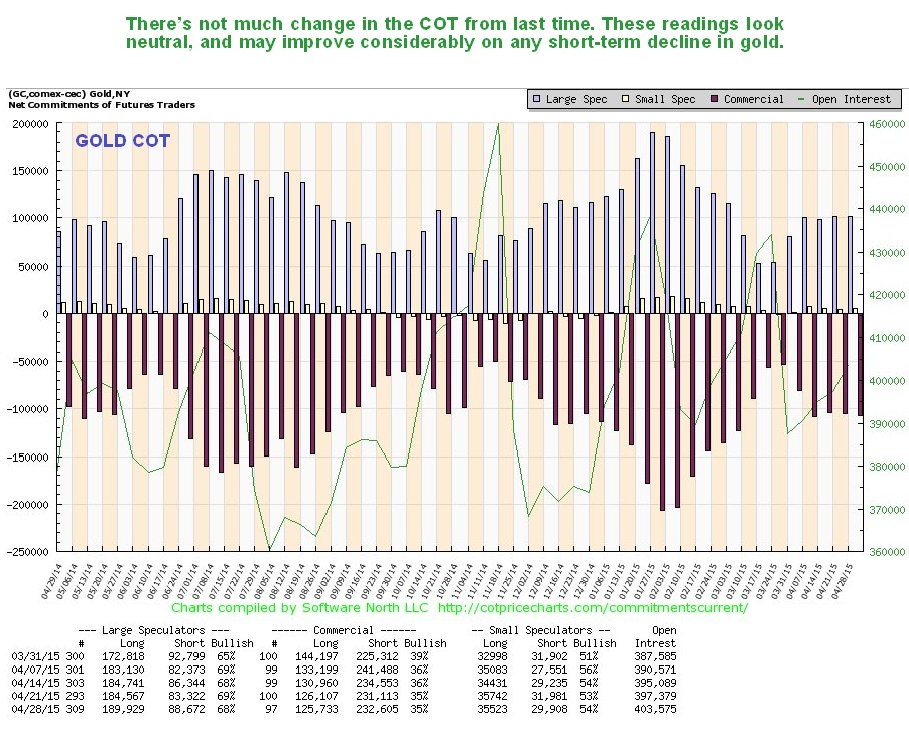
While gold’s latest COTs are in middling ground and do not give much guidance one way or the other. In the event of further such losses we will be looking for the COTs to turn strongly bullish – meaning a very low Commercial short position.
The gold Hedgers chart, a form of COT with more historical data, is in middling ground, neither bullish more bearish.
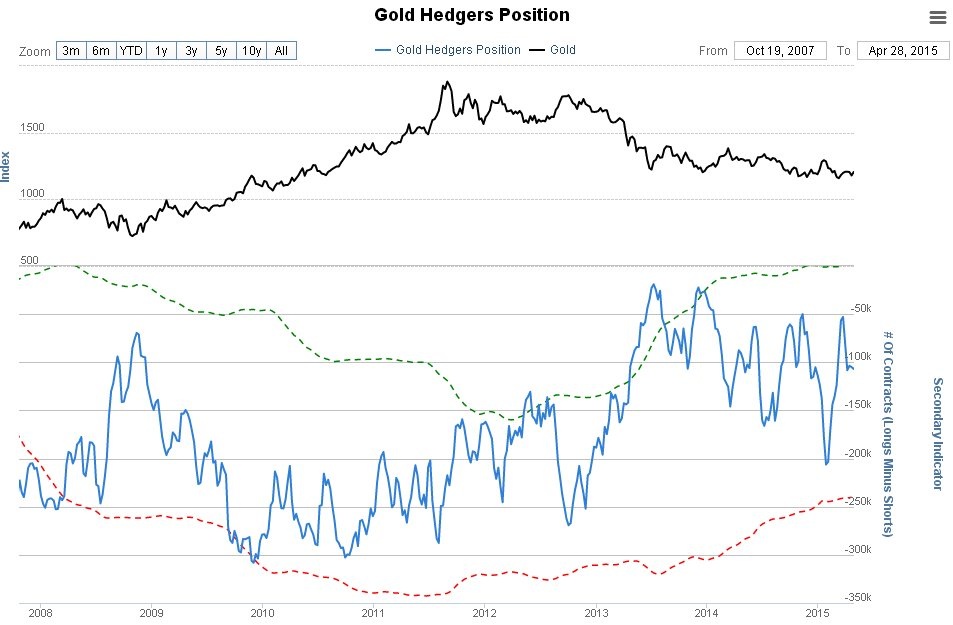
Chart courtesy of www.sentimentrader.com
The gold Optix or Optimism chart is in contrast definitely bullish. It suggests that any further drop should not carry too far, probably not below the $1000 area, and puts us on guard to watch out for an upside breakout from the major downtrend.
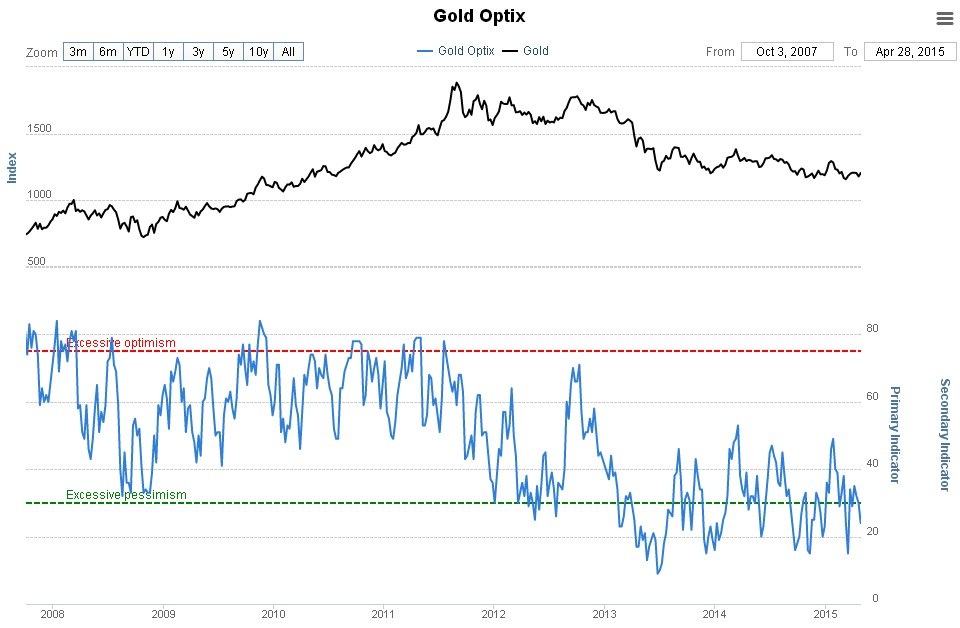
Chart courtesy of www.sentimentrader.com
The Rydex Precious Metals holdings chart is flat out bullish – no denying this, because the Rydex traders’ PM holders are at a very low level, and they are one of the most reliable contrary indicators around. This implies that we are either at or not far from a bottom here.
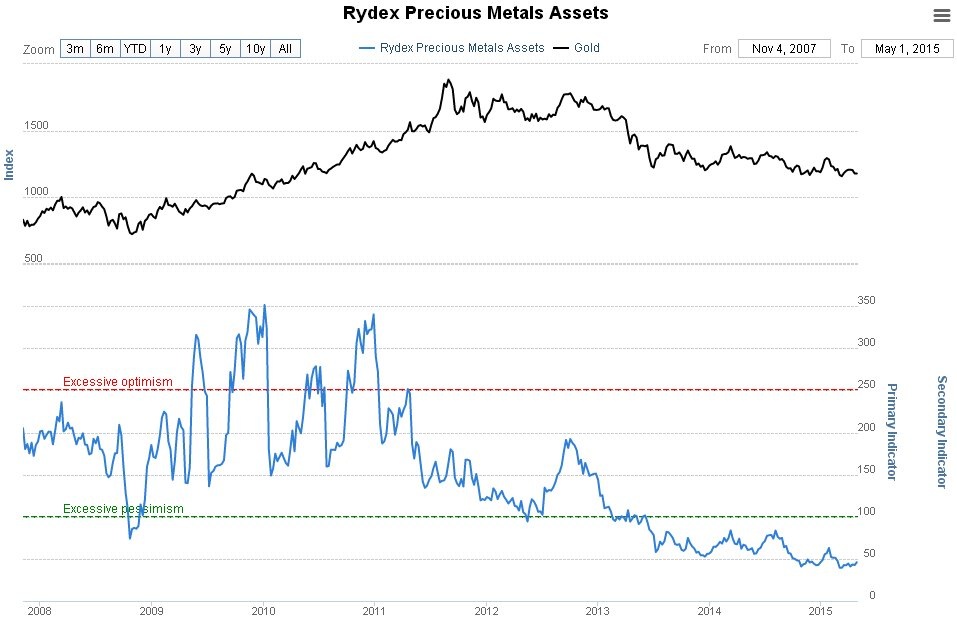
Chart courtesy of www.sentimentrader.com
Since the last update there has been a development of major importance - the dollar has broken down from its parabolic uptrend, and while the market has sensed a change, most have under rated its implications, because they are not aware of the parabolic uptrend or of what usually happens when such an uptrend fails. Many market participants think that the dollar is just stopping for a longer consolidation before it picks up again and probably advances to new highs. What usually follows a parabolic breakdown however is a severe decline. We can see the situation on the latest 1-year chart for the dollar shown below.
The Fed has skillfully used to carrot of prospective rate rises for about a year now to lure mule like foreign investors into investing in the US, when it knew it could never raise rates. What has happened in recent weeks is that these dull-witted foreigners have suddenly woken up to the fact that they have been played for suckers. That plus the prospects for an easing of the Greek crisis have taken the steam out of the dollar – and why shouldn’t the Greek crisis ease? – now that the leaders of the EU have woken up to the miracle solution of money printing as the solution to all liquidity problems – just print up a few trillion and pass it around to where it’s needed. All this is very bullish for gold as we now have Europe on board the QE train, and the Fed eventually set to do QE4, as they return for a needed fix of their drug of choice, since they know that the markets won’t countenance a rate rise.
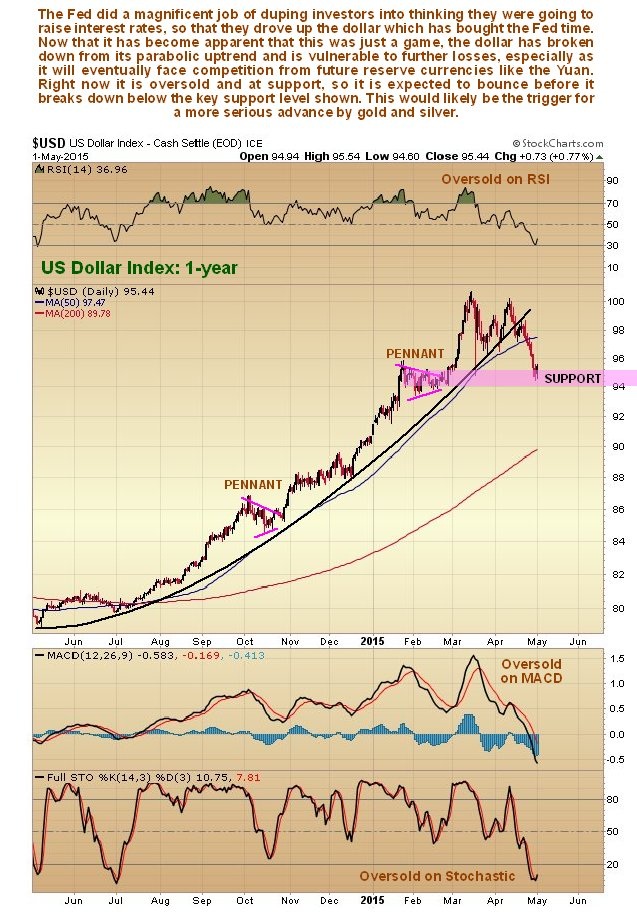
So what now for the dollar? Now that the parabolic uptrend has failed, it is vulnerable to a fairly severe decline as the mirage of rising rates vanishes – it could obviously lose all the gains of the past year which were largely the result of a conjuring trick. After the decline of the past 2 to 3 weeks it is oversold and at support, so we will probably see some sort of rally to ease the oversold condition, but after that it is likely to crash this support and drop hard, and that is where it could get very interesting for gold and silver, which could suddenly come to life.
The dollar Hedgers chart, a form of COT chart, is still strongly bearish, implying further heavy losses in the pipeline for the dollar…
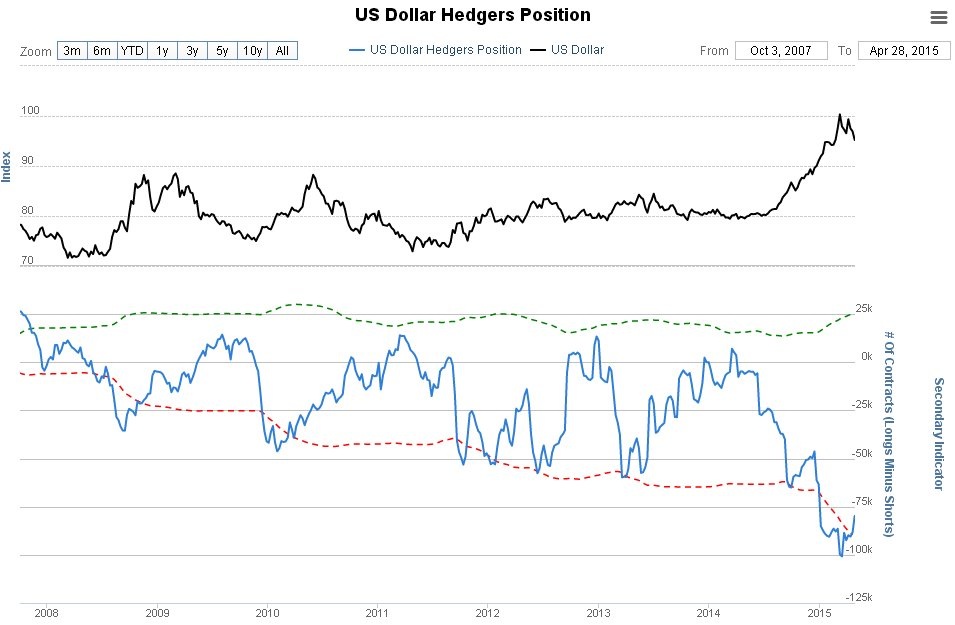
Chart courtesy of www.sentimentrader.com
The dollar Optix, or Optimism Index, has eased considerably, as you would expect after the dollar’s drop of the past several weeks, but is still bearish…
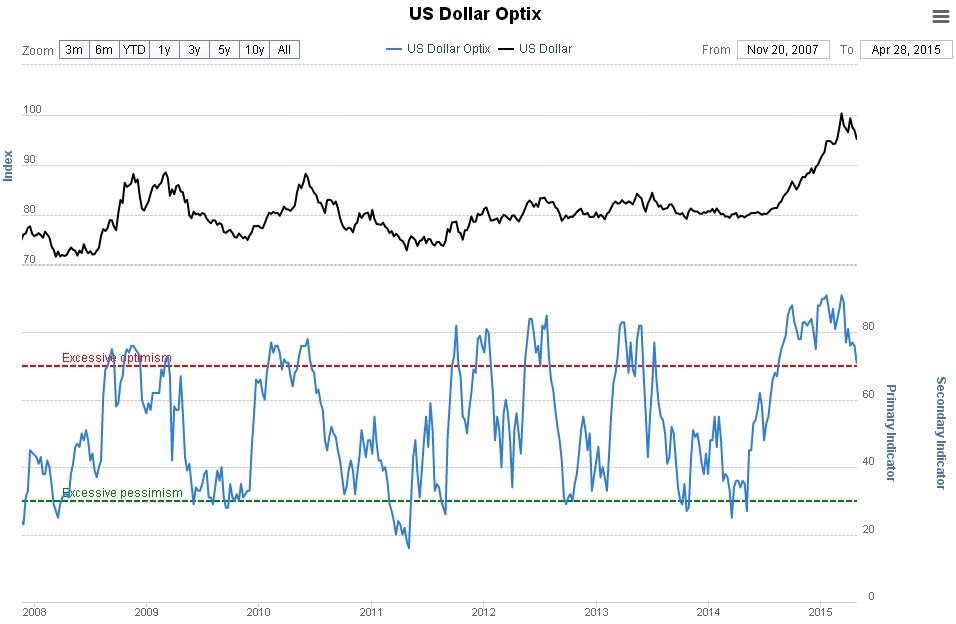
Chart courtesy of www.sentimentrader.com
Conclusion: the long mid-bull market correction in force from the 2011 highs is approaching or at its conclusion, although gold could drop to $1000 before it’s done. However further losses are looking less likely as the dollar has broken down from its parabolic uptrend and is vulnerable to a severe decline, after a short-term rally to relieve the current oversold condition. The long-term outlook for gold price and silver price is a massive parabolic ramp similar to, but much greater in magnitude to that which occurred in the 1970’s, taking gold eventually to $5000 or higher. Silver may prove to be the better investment, not just because of its potential for much higher percentage gains, but because the government (wherever you are) are much less likely to steal it – they have stolen gold from citizens in the past, but never silver because its value is less concentrated and so they can’t be bothered.
********
Courtesy of http://www.clivemaund.com/
share
share
share
share
share

Clive P. Maund’s interest in markets started when, as an aimless youth searching for direction in his mid-20’s, he inherited some money. Unfortunately it was not enough to live a utopian lifestyle as a playboy or retire very young. Therefore on the advice of his brother, he bought a load of British Petroleum stock, which promptly went up 20% in the space of a few weeks. Clive sold them at the top…which really fired his imagination. The prospect of being able to buy securities and sell them later at a higher price, and make money for doing little or no work was most attractive – and so the quest began, especially as he had been further stoked up by watching from the sidelines with a mixture of fascination and envy as fortunes were made in the roaring gold and silver bull market of the late 70’s.
Clive furthered his education in Technical Analysis or charting by ordering various good books from the US and by applying what he learned at work on an everyday basis. He also obtained the UK Society of Technical Analysts’ Diploma.
The years following 2005 saw the boom phase of the Gold and Silver bull market, until they peaked in late 2011. While there is ongoing debate about whether that was the final high, it is not believed to be because of the continuing global debasement of fiat currency. The bear market since 2011 is viewed as being very similar to the 2-year reaction in the mid-70’s, which was preceded by a powerful advance and was followed by a gigantic parabolic price ramp. Moreover, Precious Metals should come back into their own when the various asset bubbles elsewhere burst, which looks set to happen anytime soon.
Visit Clive at his website: CliveMaund.com


