Gold Market Update


In the last update we had thought that gold might escape its usual seasonal malaise this year, but it didn’t and went into a rather sharp downtrend and dropped again quite sharply on Friday. The good news though is that this drop has not impacted the big picture at all, which remains strongly bullish, and a bonus is that this drop has flushed out a lot of remaining weak hands, as we will see when we come to the latest COT charts and set the sector for a reversal soon leading to a strong uptrend.
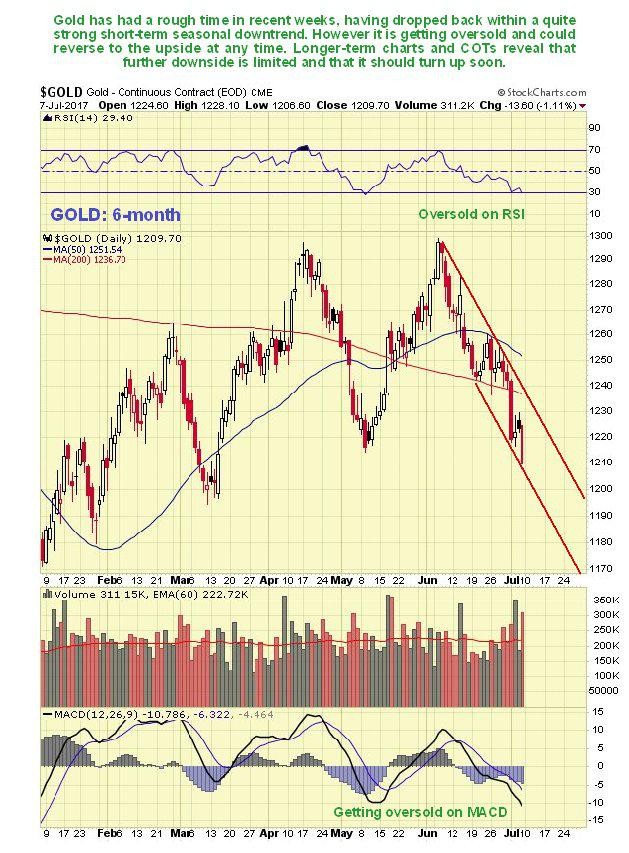
On the latest 6-month gold chart we can see the downtrend in force from early June which on Friday took the price beneath the May low. Moving averages are in bearish alignment…but gold is now oversold on its RSI and getting oversold on its MACD indicator.
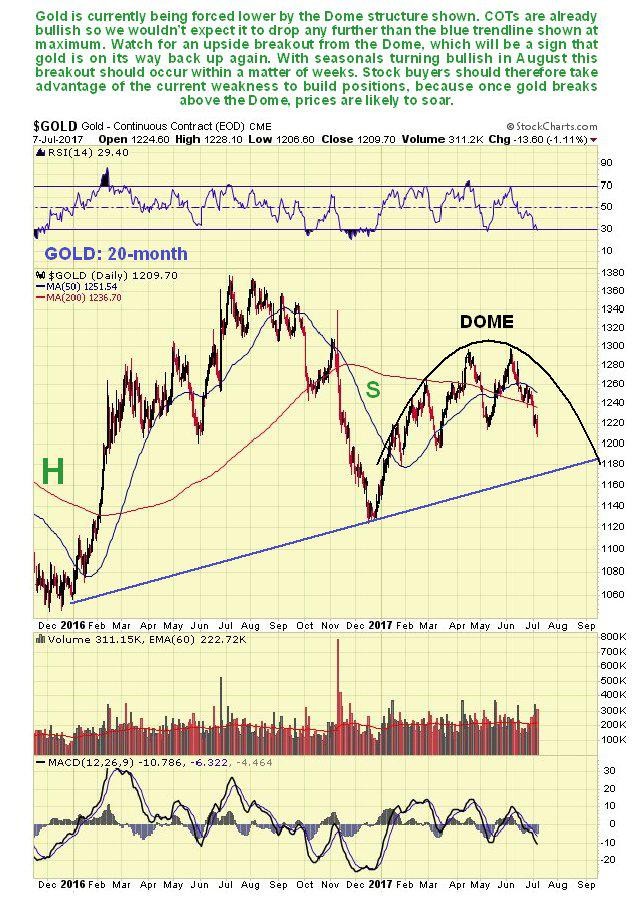
On the 20-month chart we can see that gold is being forced lower beneath a Dome pattern. With COTs and sentiment already becoming strongly bullish, we would not expect gold to drop further than the blue trendline shown, especially as bullish seasonal factors will be kicking in towards the end of the month too. We are therefore looking for gold to break out above the Dome before too much longer, which will be a strongly bullish development marking the start of a growth phase.
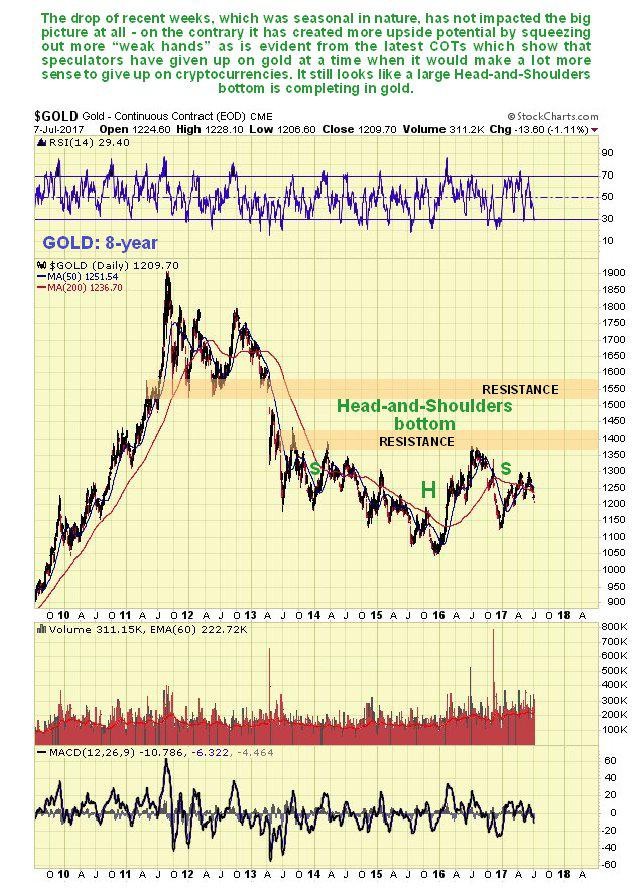
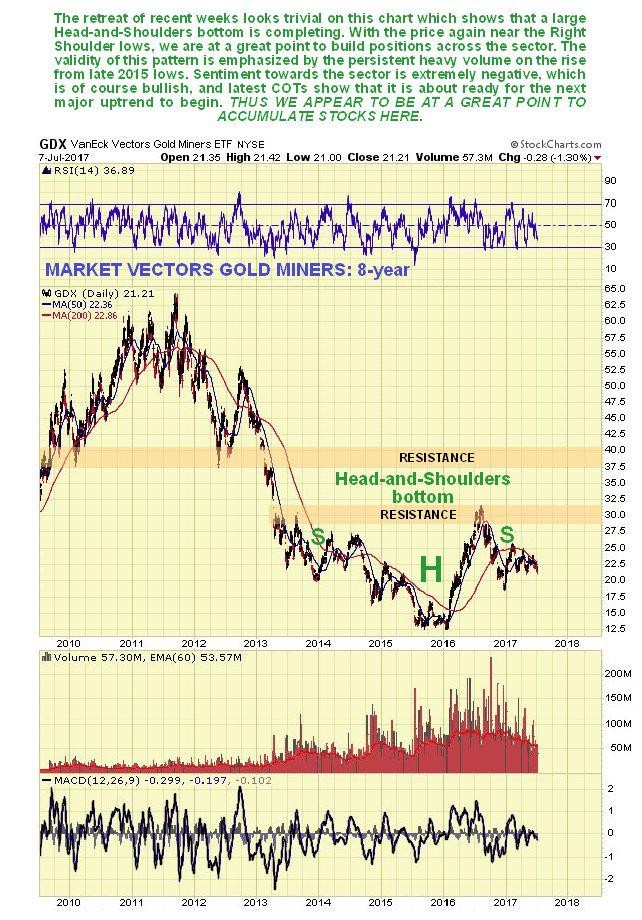
The long-term 8-year chart continues to show a large Head-and-Shoulders bottom completing in gold, and on this chart the drop of recent weeks looks miniscule and as we can see, it has not impacted this big picture at all. If this interpretation is correct, then we are an excellent point to buy here from a price / time perspective. It is rather amazing to think that this bottoming pattern in gold started to form way back in mid-2013.
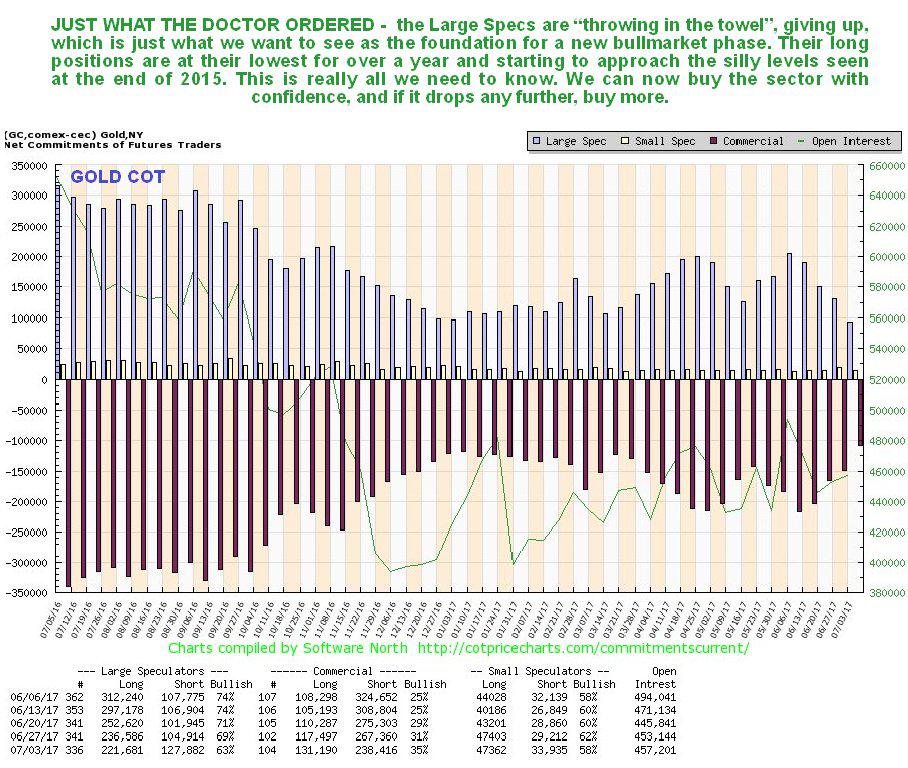
Gold’s latest COT chart looks increasingly bullish, with the Large Specs at last giving up and “throwing in the towel” as shown by their long positions shrinking back quite dramatically over recent weeks, so that they are now approaching the extremely low levels seen at the December 2015 lows. This is very good news indeed for would be investors in the sector, and while there is scope for even more improvement, as would be occasioned by further losses across the sector, the scope for such improvement is now very limited. Meaning that we are either at or very close to a major bottom here, so it is good time to load up with the better gold and silver stocks, and here we should note that this sector tends to be contra-cyclical to the broad market, so it is likely to do well if the broad market drops.
Click on chart to popup a larger, clearer version.
The long-term 8-year chart for gold stocks proxy GDX shows a large Head-and-Shoulders bottom pattern completing that closely corresponds with the one completing in gold itself, and the validity of this pattern is emphasized by the persistent strong volume on the rise out of the “Head” of the pattern, from the late 2015 lows. With the price now near to the Right Shoulder lows of the pattern, we are believed to be at a great point to build positions in Precious Metals stocks, especially as we have the luxury of knowing that sentiment towards the sector is awful, meaning that the mob won’t touch these stocks with a 10-foot pole, same as late in 2015, with COTs now looking strongly bullish too, and any further short-term decline will simply change the picture from very bullish to extremely bullish.
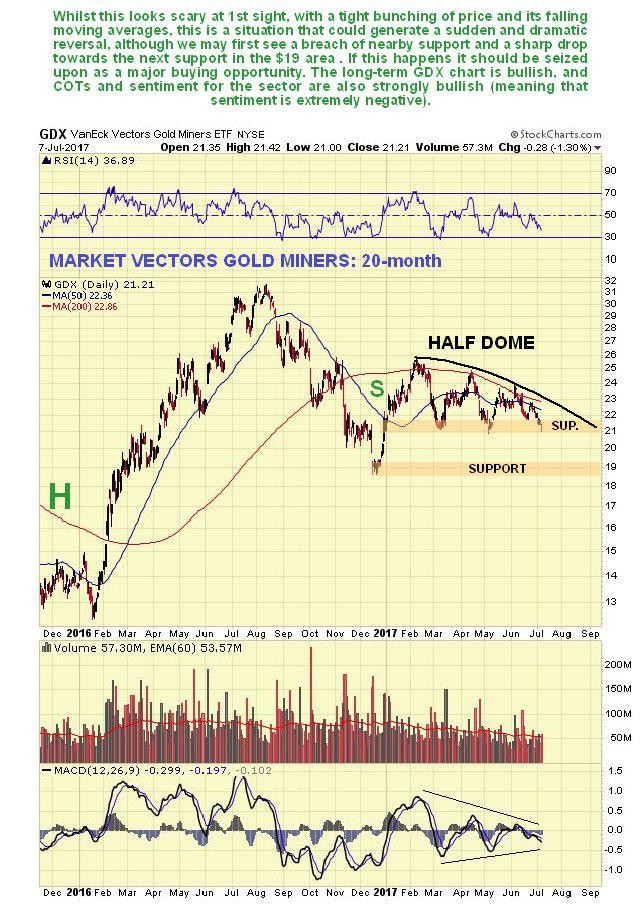
Whilst the 20-month chart for the GDX looks rather scary and off-putting at first as the series of lower lows in the recent past and down sloping moving averages suggest that nearby support will be breached and GDX drop quickly to the next support in the $19 area, various factors suggest a sharp reversal is brewing, although admittedly this could occur on a drop to about $19. These factors are the tight bunching of price and moving averages and as mentioned above, bullish COTs and sentiment indicators. Look for either a prominent reversal candle or candles soon, or a break above the boundary of the Half Dome shown.
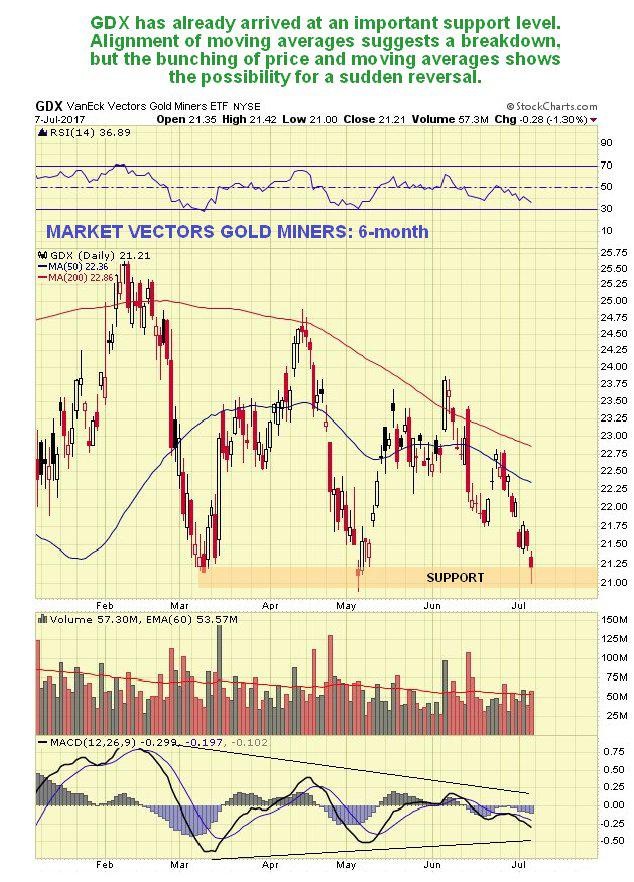
The 6-month chart for GDX shows the action of recent weeks in detail and how it is dropped down to a support level. Even if this is breached, the bullish factors mentioned above are expected to lead to a reversal to the upside before long.
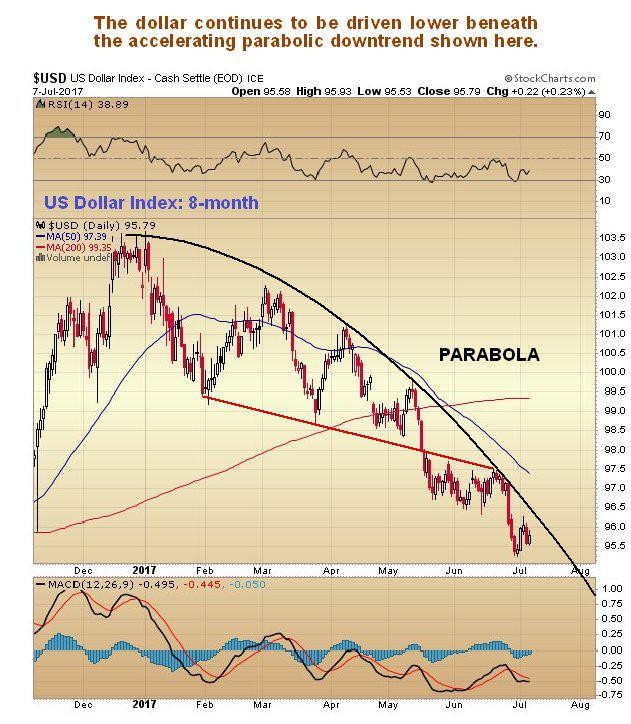
The charts for the dollar index meanwhile continue to look grim. On the 8-month chart we can see it dropping away beneath a parabolic downtrend that is accelerating to the downside. If this parabolic downtrend continues to force the dollar lower it should have a positive impact on the gold price, although it hasn’t thus far. A break above the parabola by the dollar would of course be bullish for it.
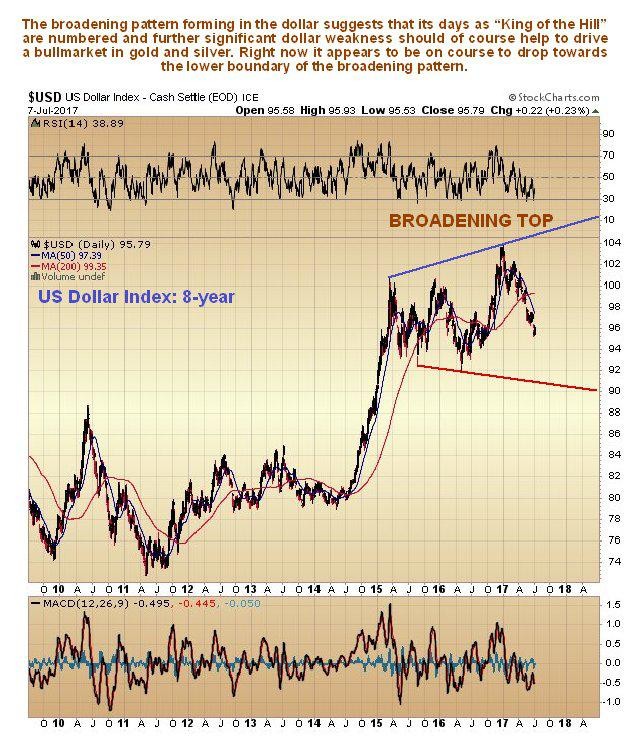
The 8-year chart for the dollar index doesn’t look inspiring either. A large bearish Broadening Pattern appears to completing, and right now it appears to be on course to drop towards or to its lower boundary, currently at about 90.5. A breach of the lower boundary should lead to further losses and may result in acceleration to the downside. Further significant weakness in the dollar should of course be bullish for gold and silver.
On a more esoteric note, as has been pointed out elsewhere, gold and silver, and especially silver, tends to reverse at times of full moons, and we just had a full moon over the weekend, and what could have been a reversal candle in silver on Friday, so we may be at the point of a sector reversal here. As pragmatic traders we don’t have to concern ourselves why this is – if it is shown to work, we can use it.
Finally, while we are considering such matters you may have read of the big buildup in seismic activity beneath the Yellowstone super volcano with hundreds of tremors occurring in recent weeks. Timing its next major eruption is a bit tricky, to say the least, since the last one was about 640,000 years ago, but it is way overdue apparently and it may just be an ominous portent that there is a total eclipse of the sun right across the heart of the US next month whose path of totality runs across Grand Teton, just south of Yosemite, beneath which lies the vast magma chamber underlying Yellowstone. This is not to say that this will necessarily synchronize with a mega eruption, but let’s put it this way, if I was a Ranger at the park I might choose to take some vacation and go see the eclipse somewhere safer such as Oregon or South Carolina. It’s just a shame that the Fed won’t be meeting at Jackson Hole at this time. We shouldn’t expect the authorities to warn of such a thing of course, they don’t want to create panic and cause people to scatter, and then be subject to the inevitable recrimination if nothing happens. Apart from destroying the United States what effect would a Yellowstone mega eruption have on the price of gold? This is hard to predict as we have no precedent for something of this magnitude. One thing we do know is that any manipulation of the gold price by COMEX will instantly cease as it will be buried under about 8 feet of volcanic ash, even at its great distance. This could therefore be the time when the Shanghai Gold Exchange really comes into its own and takes center stage. You know what they say – it’s an ill wind that blows no-one a bit of good!
********

Clive P. Maund’s interest in markets started when, as an aimless youth searching for direction in his mid-20’s, he inherited some money. Unfortunately it was not enough to live a utopian lifestyle as a playboy or retire very young. Therefore on the advice of his brother, he bought a load of British Petroleum stock, which promptly went up 20% in the space of a few weeks. Clive sold them at the top…which really fired his imagination. The prospect of being able to buy securities and sell them later at a higher price, and make money for doing little or no work was most attractive – and so the quest began, especially as he had been further stoked up by watching from the sidelines with a mixture of fascination and envy as fortunes were made in the roaring gold and silver bull market of the late 70’s.
Clive furthered his education in Technical Analysis or charting by ordering various good books from the US and by applying what he learned at work on an everyday basis. He also obtained the UK Society of Technical Analysts’ Diploma.
The years following 2005 saw the boom phase of the Gold and Silver bull market, until they peaked in late 2011. While there is ongoing debate about whether that was the final high, it is not believed to be because of the continuing global debasement of fiat currency. The bear market since 2011 is viewed as being very similar to the 2-year reaction in the mid-70’s, which was preceded by a powerful advance and was followed by a gigantic parabolic price ramp. Moreover, Precious Metals should come back into their own when the various asset bubbles elsewhere burst, which looks set to happen anytime soon.
Visit Clive at his website: CliveMaund.com
More from Gold-Eagle


