Gold Market Update


Over the short to medium-term gold is likely to be buffeted by conflicting cross currents as we will proceed to see a little later, so it is important to keep a handle on the big picture, and for this reason we will start by reminding ourselves how bullish the big picture is for gold by looking at its long-term chart.
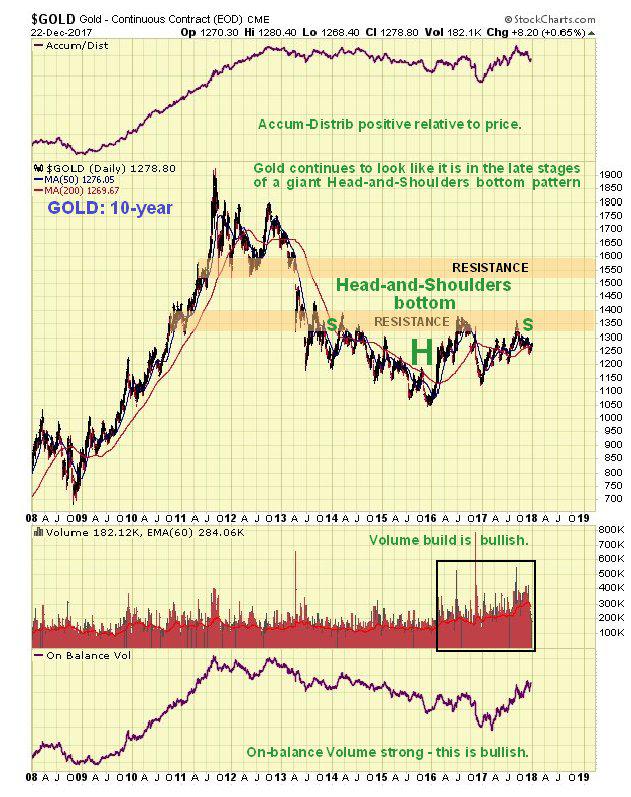
On its 10-year chart we see that gold is in the late stages of a large Head-and-Shoulders bottom, which it is expected to break out of not far into 2018. This is a huge base pattern that can support major bullmarket. Points worth noting on this chart are the marked volume buildup during the last half of the year and the steady rise in volume indicators this year, especially the On-balance Volume line – these developments suggest that gold is building up to something, after being a sideshow during 2017 due to rising stockmarkets and the cryptocurrency mania. The key level to note is $1400 – a breakout above this level will signify that gold is leaving behind the base pattern to enter a new bullmarket phase.
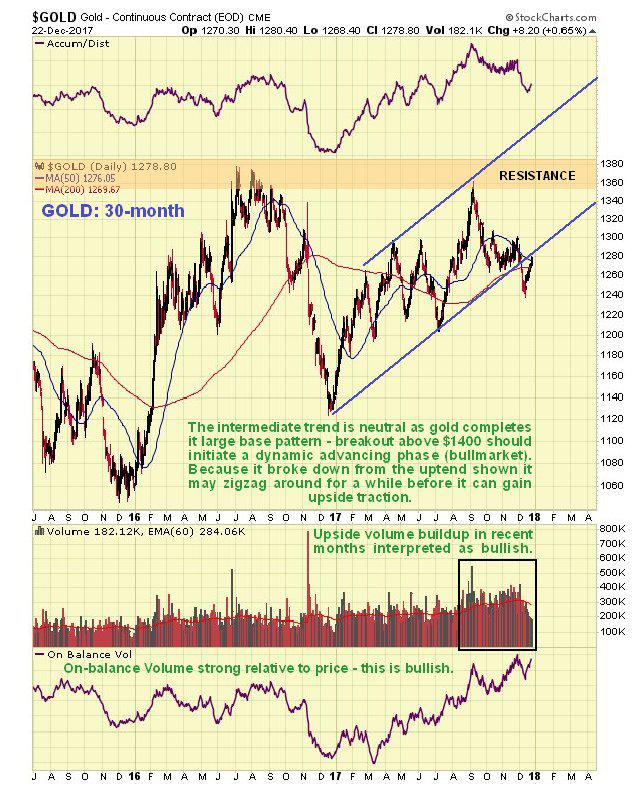
The 30-month chart enables us to see in detail the period from the low of the base pattern late in 2015. Following this low, which was the low point of the Head of the Head-and-Shoulders bottom, the gold price rallied quite steeply, which coincided with a spectacular rally in Precious Metals stocks, but then dropped back to mark out the Right Shoulder low in December of last year, almost exactly a year after marking out the low of the Head of the pattern. Since that low gold has advanced in a rather sedate manner this year as it gradually readies to break out of the entire base pattern. At this point the trend is best described as neutral and it will remain so until it breaks above $1400, although that is not a reason not to buy it at opportune times, since we can be pretty sure that a breakout is looming.
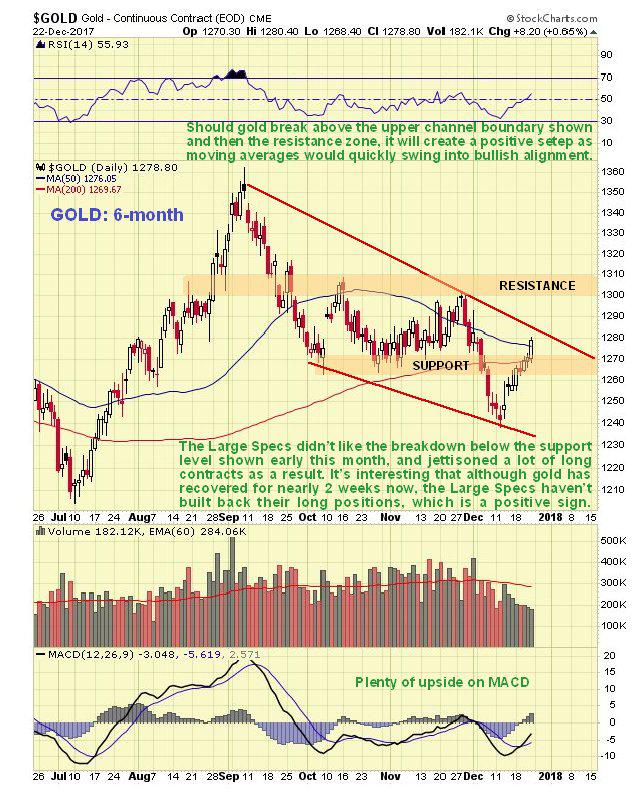
On the 6-month chart we can see recent action in detail. The breach of support in the $1260’s and drop below the 200-day moving average early this month seems to have freaked out a lot of traders, who overreacted by rushing to dump long positions. After this drop the gold price has recovered over the past week or two, and has now risen into a zone of resistance.
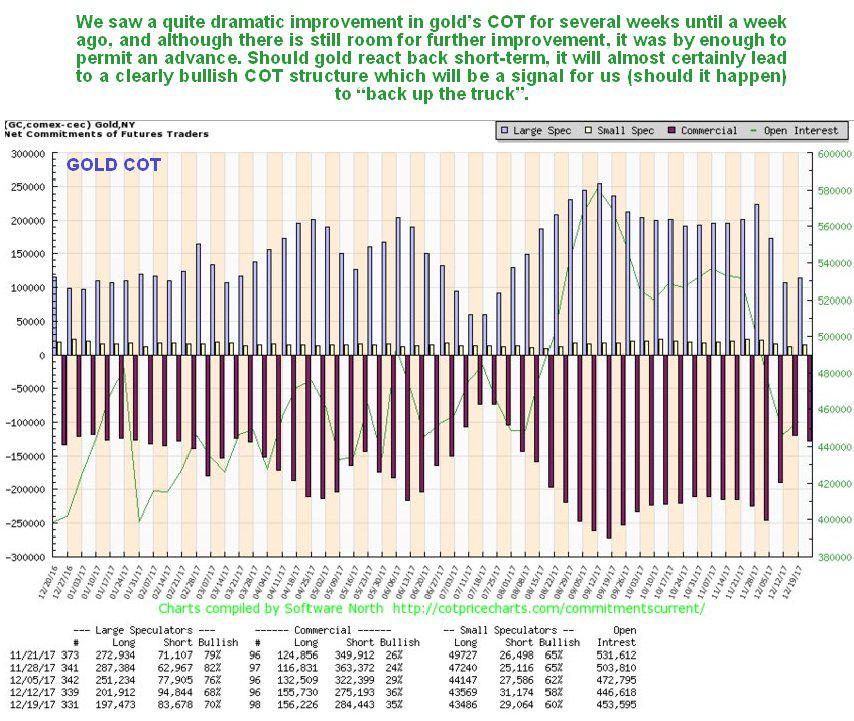
We have been wary of the Precious Metals sector for many weeks because of the persistent high Large Spec long positions, as we can see on the latest COT chart below, but this last drop by gold unnerved the Large Specs, who dumped a sizeable portion of their long positions, which action has improved gold’s COT structure considerably, although there is room for further improvement. The situation in silver was rather different, because the Large Specs bailed out of almost all their long positions, creating a flat out bullish COT structure for silver now. Overall, we would have to say that the COT structure for gold is now modestly bullish, with the chances of gold holding up or advancing further improved by the positive outlook for silver.
Click on chart to popup a larger clearer version.
The latest gold Hedgers chart shows Hedgers positions to be squarely in neutral territory, and this chart thus provides no guidance one way or the other…
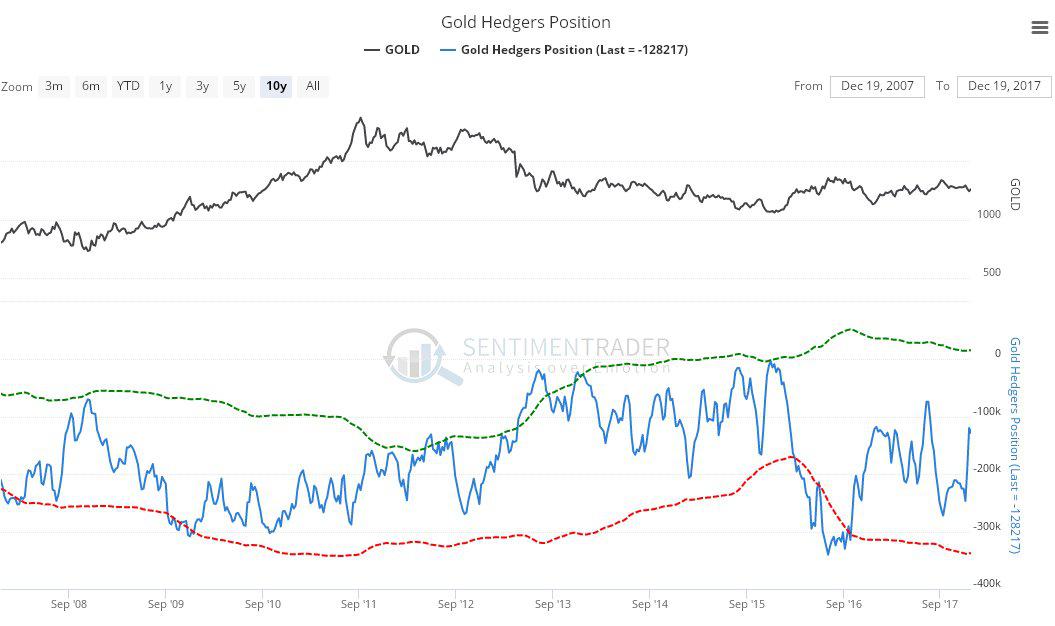
Click on chart to popup a larger clearer version.
Chart courtesy of sentimentrader.com
The following chart shows that seasonal factors are quite bullish for gold in January, after being rather negative in December…
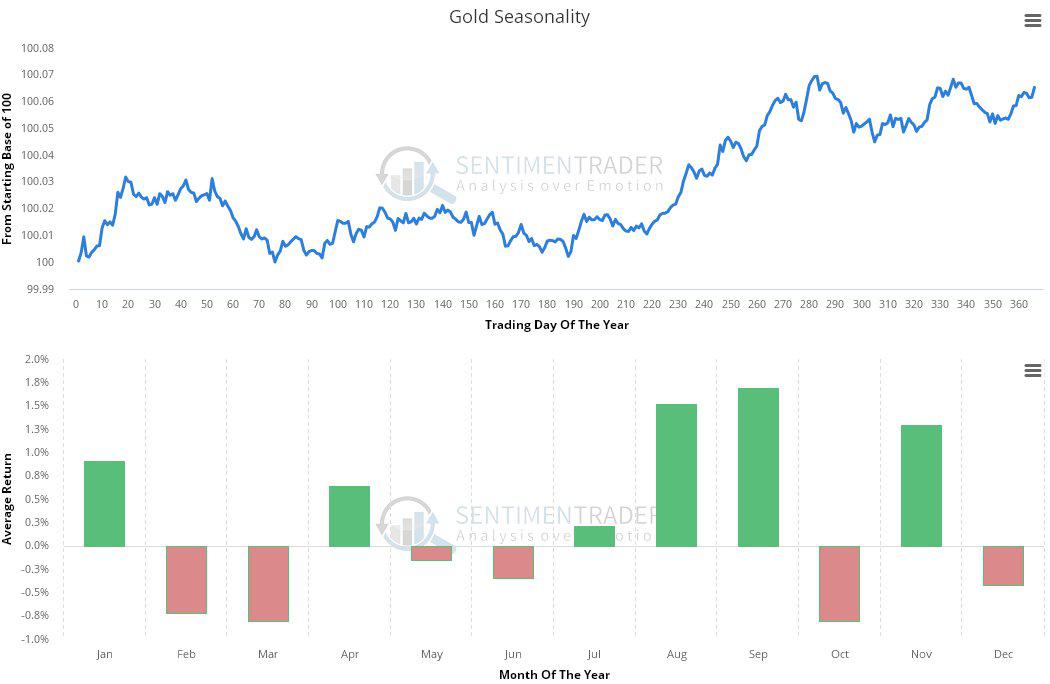
Chart courtesy of sentimentrader.com
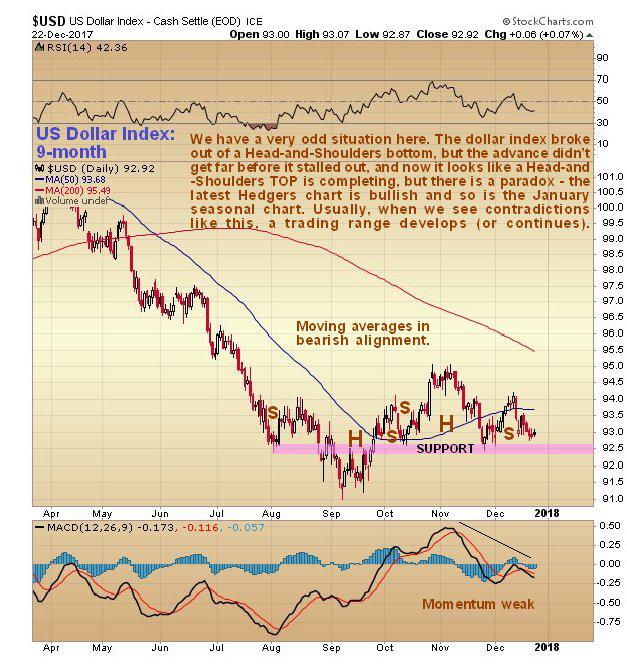
As ever, when considering the outlook for gold, we have to factor in the likely impact of dollar movements, so how does the dollar look? The 9-month chart for the dollar index presents a rather ambiguous picture. We did get a dollar rally between September and November as we were expecting, but it didn’t get as far as we thought it would before it turned down again, and what looked like a Head-and-Shoulders bottom from August through October morphed into an apparent Head-and-Shoulders top from October through December, and with momentum weak and moving averages in bearish alignment, the dollar increasingly looks sets to break lower on this chart.
However, there are two opposing factors on the other side of the scales that we must weigh against the bearish looking dollar index chart. One is the latest dollar Hedgers chart, which shows that Hedgers’ positions are at levels that have in the past led to rallies…
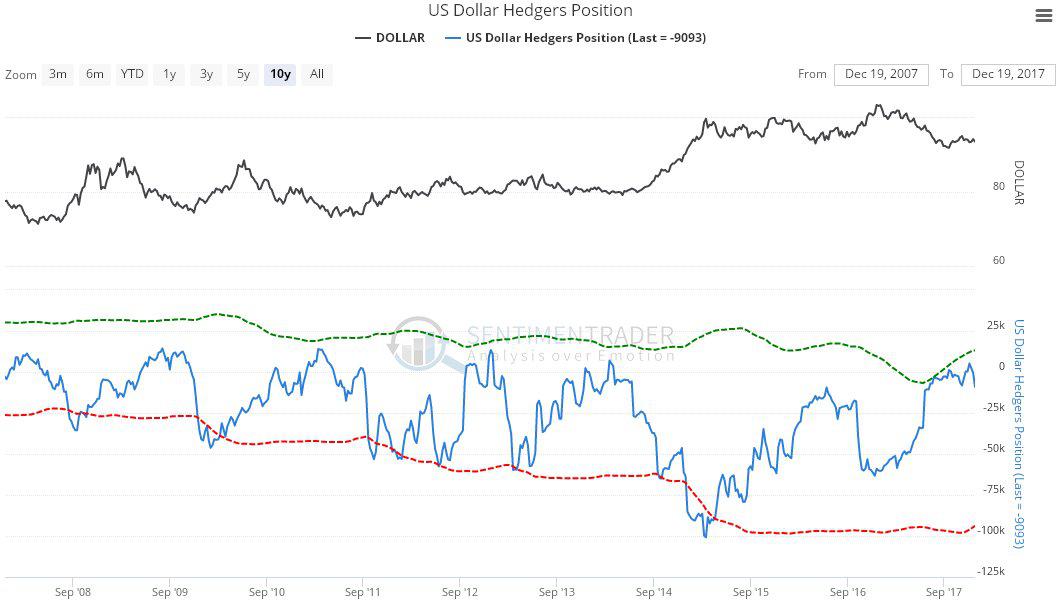
Click on chart to popup a larger clearer version.
Chart courtesy of sentimentrader.com
And in addition the dollar is about to enter its most seasonally bullish month of the year, although it must be emphasized that this is a background factor…
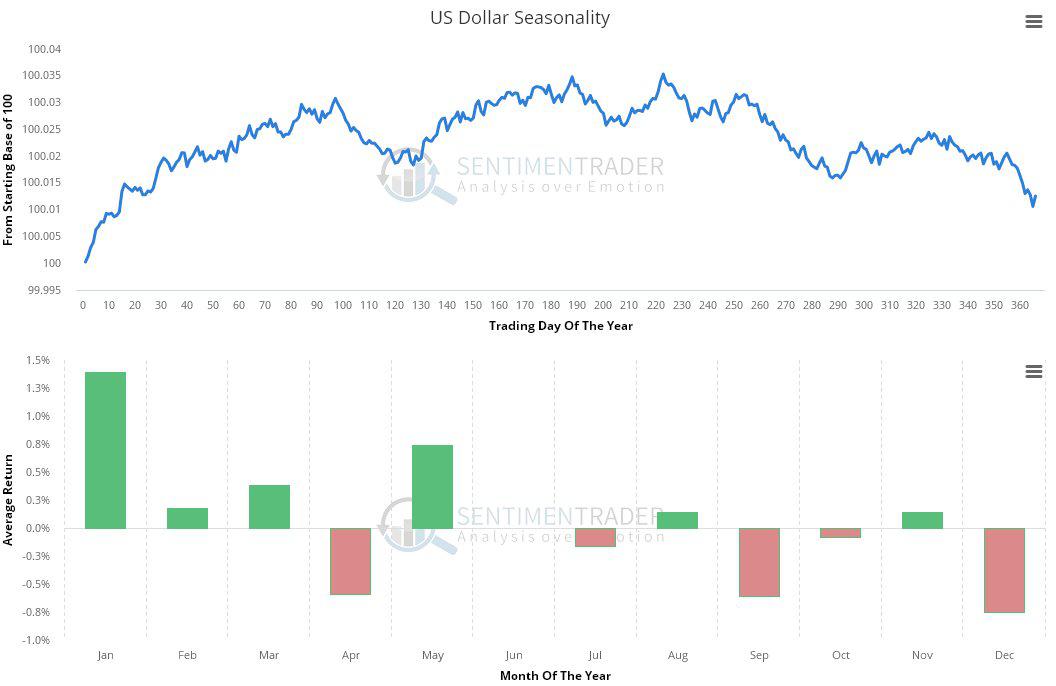
Chart courtesy of sentimentrader.com
This is a difficult set of opposing factors to weigh up, but experience shows that when one has a set of conflicting indications like this, it usually leads to rangebound behavior, until the conflicting factors resolve and the picture becomes clearer.
The conclusion to all this is that gold is building up to breaking out of its giant Head-and-Shoulders bottom to enter a major bullmarket phase, the start of which will be marked by gold breaking above $1400. In the meantime, before this breakout occurs, we can expect to see more erratic rangebound sideways trading behavior, with dips providing the opportunity to accumulate gold and especially undervalued PM stocks, since the risk of a more serious decline is considered to be very low.
*********

Clive P. Maund’s interest in markets started when, as an aimless youth searching for direction in his mid-20’s, he inherited some money. Unfortunately it was not enough to live a utopian lifestyle as a playboy or retire very young. Therefore on the advice of his brother, he bought a load of British Petroleum stock, which promptly went up 20% in the space of a few weeks. Clive sold them at the top…which really fired his imagination. The prospect of being able to buy securities and sell them later at a higher price, and make money for doing little or no work was most attractive – and so the quest began, especially as he had been further stoked up by watching from the sidelines with a mixture of fascination and envy as fortunes were made in the roaring gold and silver bull market of the late 70’s.
Clive furthered his education in Technical Analysis or charting by ordering various good books from the US and by applying what he learned at work on an everyday basis. He also obtained the UK Society of Technical Analysts’ Diploma.
The years following 2005 saw the boom phase of the Gold and Silver bull market, until they peaked in late 2011. While there is ongoing debate about whether that was the final high, it is not believed to be because of the continuing global debasement of fiat currency. The bear market since 2011 is viewed as being very similar to the 2-year reaction in the mid-70’s, which was preceded by a powerful advance and was followed by a gigantic parabolic price ramp. Moreover, Precious Metals should come back into their own when the various asset bubbles elsewhere burst, which looks set to happen anytime soon.
Visit Clive at his website: CliveMaund.com


