Gold Market Update
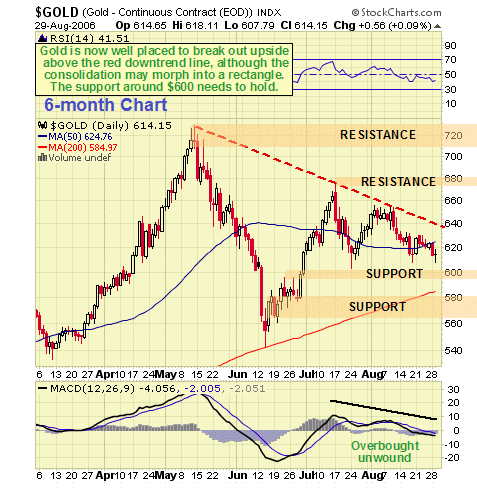
After a lengthy period consolidating in a large trading range gold is now in position to break higher. It has behaved pretty much as predicted in the last update, dropping back towards the important support at $600. It was expected to fall to the $600 level, but in the event has found support a little higher in the $610 area. The reaction of the past several weeks has had several positive technical effects. The first is that, as part of the larger consolidation pattern following the May peak, it has obviously allowed gold further time to digest the large gains leading up to the May highs. The second is that it has now completely unwound the somewhat overbought condition that had existed at the start of the month, as shown by the MACD indicator at the bottom of the chart. Lastly, it has allowed time for the 50-day moving average to flatten out and turn up and for the 200-day to catch up further. This is therefore considered to be a good point to buy gold, especially as, with strong underlying support in the $600 - $610 area, traders always have the option of exiting for safety should this support fail, and later re-entering when the picture improves again.

In the last two updates the large consolidation pattern following the May highs was viewed as taking the form of a Symmetrical Triangle, and in the absence of a clear lower boundary to this pattern, the 200-day moving average may be loosely taken as serving as the lower boundary. Using this we can see that the upper and lower boundaries are rapidly converging and thus we are likely to see a breakout above the upper boundary soon. Although such a breakout could lead to the triangle morphing into a Rectangle, which would mean a continuation of the consolidation pattern in another form, the action in stocks suggests that it is more likely to mark the start of a new intermediate uptrend in gold that should lead, at least, to it challenging the May highs before probably going on to take out these highs and then leave behind the consolidation as it advances away from it.
Silver Market Update
Clive Maund
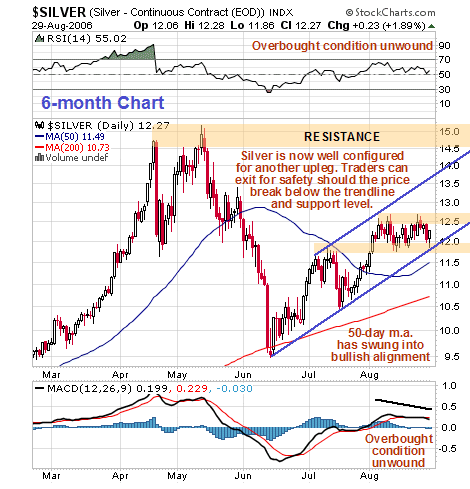
Silver is now in position to advance. Although it appears to have “done nothing” price wise over the past month, moving sideways within a narrow range, its technical condition is believed to have improved considerably. In the last update we expected it to react back to the lower boundary of the channel that started from the June low, but instead it has completed a “time correction”, by drifting sideways in a narrow range, sandwiched between support and resistance, marking time until the channel boundary caught up, which it has now done. This action has had several positive technical effects. The first is that the short to medium-term overbought condition that had developed by early August has completely unwound. The second is that by not reacting, and instead moving sideways, it has soaked up more of the overhanging supply from the earlier top area, thus reducing the resistance to a future advance. Finally, the stalling for time has allowed the 50-day moving average to swing from sloping downwards to sloping upwards, putting silver in a much better position to advance.

A great advantage for traders opening long positions at this time is that, due to the proximity of important support, a highly advantageous risk/reward ratio can be defined. This is because, as we can see on the 6-month chart, the lower channel boundary of the intermediate uptrend is now not far beneath the price and currently at about $11.90, and at this juncture it coincides with a support level at the lower boundary of the last month’s trading range, which sits atop the July peak. Traders can therefore enter positions here, and exit for safety on a closing break below the channel line AND the low point of the recent range. While it can be argued that this approach makes the trader vulnerable to being whipsawed out, this is an acceptable risk, especially as positions can simply be re-entered in the event of the picture subsequently improving again.
Clive Maund, Diploma Technical Analysis
Kaufbeuren, Germany, 13 August 2006


