Gold Market Update
In this Gold Market update we are going to "cast our net wide" and consider the outlook not just for gold and PM stocks but also the dollar, other commodities and the the broad US stockmarket. The reason for this is that COMMODITY AND STOCKMARKETS ARE AT A CRITICAL JUNCTURE AND MUST REVERSE TO THE UPSIDE IMMEDIATELY to avert the risk of a catastrophic decline, similar to 2008 or even worse. The severe deterioration last week, which included a sharp breakdown by copper and PM stock indices starting to break down, and also the erosion of critical support in commodity and stockmarkets generally, has greatly increased downside risk. Should these markets accelerate into freefall, it will mean that the specter of deflation has come back to haunt the markets.
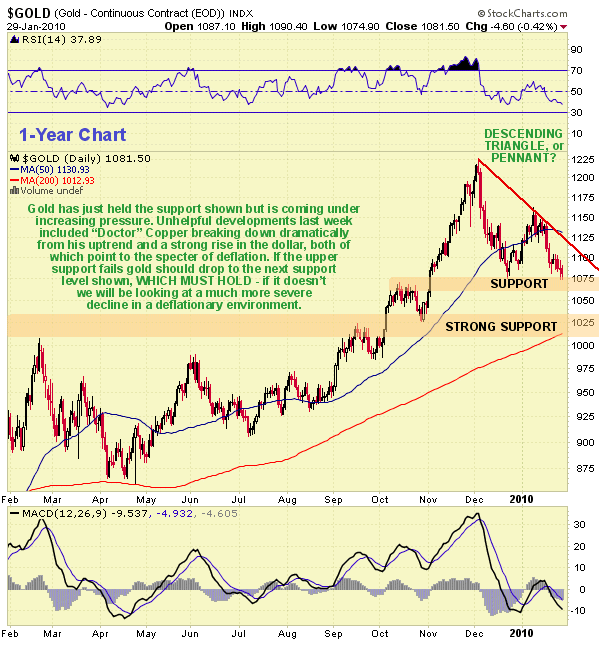
We will start with a look at gold. On its 1-year chart we can see that it is in a potential Descending Triangle pattern, and actually did quite well last week to hold up above the support at the bottom of it, considering the sharp breakdown in copper and the strength in the dollar. If it is a genuine Descending Triangle, then it will go on to break lower, although there is some chance that the pattern is instead a large bullish Pennant. A break below the support at the bottom of the Triangle would be expected to lead to an immediate drop to the next support level in the $1010 - $1030 area, which is a particularly strong zone of support as it runs along the top of the large 20-month consolidation pattern that led up to the advance late last year, that could put a floor under gold and turn it up again. However, should this support later fail it would be a very bearish development for the intermediate-term that would be expected to lead to further heavy losses. One possibility here that is suggested by the deeply oversold condition of other commodities/stock indices, is an immediate weak rally back up to the red descending trendline that could then be followed by breakdown.
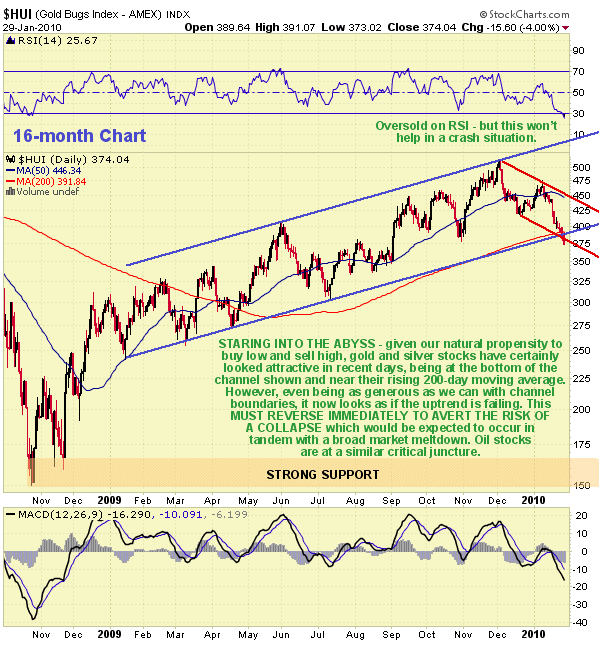
It is bad news for gold that PM stocks appear to be breaking down from their uptrend that was in force all this year, as is plain on our 16-month chart for the HUI index - even being generous in the positioning of our lower trendline it is clear that it is breaking down - IT MUST REVERSE TO THE UPSIDE IMMEDIATELY TO AVERT THE RISK OF A PRECIPITOUS DECLINE AND A BREAK LOWER BY GOLD (AND SILVER).
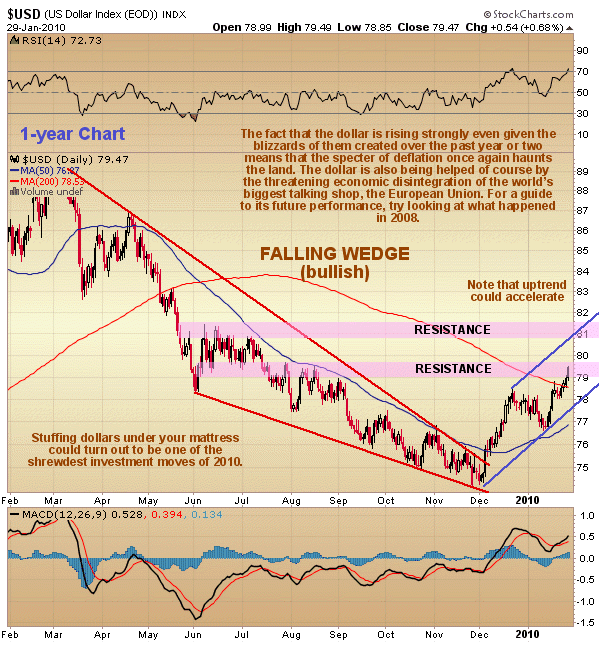
It is also bad news for gold that the dollar has embarked on the next leg of an uptrend that appears to be becoming established, with the prospect of a "golden cross" soon, where the 50-day moving average rises up through the 200-day and the latter then turns up - although this development would certainly not be golden for gold. This is already looking like a rerun of 2008, and given that NONE OF THE UNDERLYING CAUSES OF THE CRISIS HAVE BEEN SQUARELY ADDRESSED, and that they have simply "papered over the cracks" by printing up vast quantities of money, which is the equivalent of throwing water on a chip pan fire, it is a fair assumption that if deflationary forces gain the upper hand again, the collapse will be considerably worse than that of 2008.
Silver (see Silver Market update) has dropped steeply back to key support just above its rising 200-day moving average and is now deeply oversold. Normally we would expect to see at least a bounce here, which suggests a temporary respite for gold. However, given the general deterioration, the risk that this support will fail, probably after a bounce, is growing.
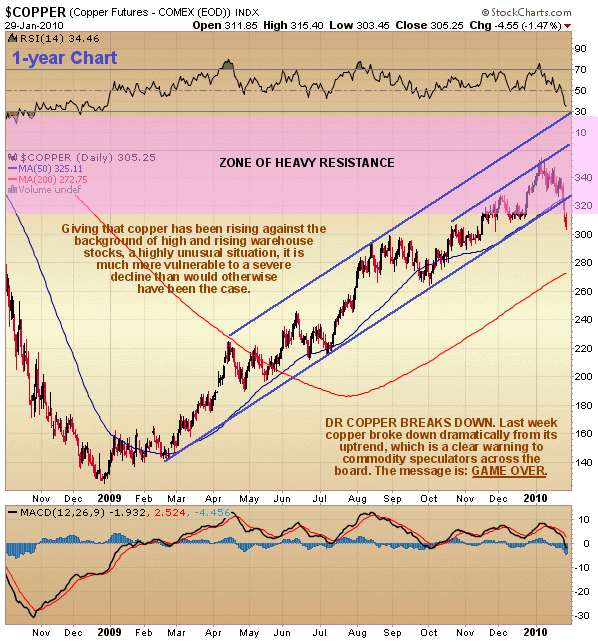
A particularly worrying development for commodity and stockmarkets is the sudden sharp breakdown by copper last week, an event that was predicted on the site shortly before it occurred. Not for nothing is copper called Dr Copper - it frequently presages developments in the economy and the markets, acting like the proverbial canary in the coal mine. So this breakdown is seriously bad news for the markets. For months copper has been rising against the background of steadily increasing warehouse stocks, which is a tribute to the mindless opportunism of many speculators, especially when their wheels have been greased by the dollar carry trade gravy train. The fact that this is rapidly coming to an end as the dollar rises, coupled with the high and rising stockpiles, is a recipe for a precipitous decline in copper. The Commercials, who had run up massive short positions in copper in recent weeks as we had earlier observed, have been "fattening up" the Large Specs for the kill for some time, as we had earlier observed, and should soon be able to feast on their succulent carcasses.
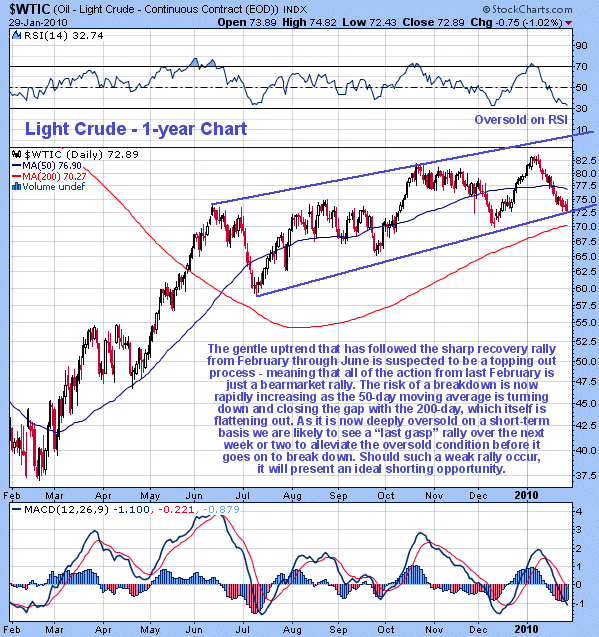
Not to be left off the critical list, oil is at key support right at the bottom of its uptrend channel and just above its rising 200-day moving average. On the 1-year chart for Light Crude we can see that after a fairly robust uptrend from March through June of last year, called on the site just as it started, which served to at least partially correct the downside excesses of 2008, crude settled into a gentle uptrend channel, which has continued up to the present and is believed to a topping out process. Normally we would consider the current contact with the lower trendline near the 200-day m.a. to be the ideal buy spot, but while it is expected to bounce here, it is unlikely to get very far due to the rapidly deteriorating situation overall. How far might it bounce and over what timeframe? - probably no higher than the $76 - $77.50 area within a week or two. The fact that the 50-day moving average is now rolling over and dropping back towards the 200-day, which itself is starting to flatten out, is a circumstance that is increasing downside risk.
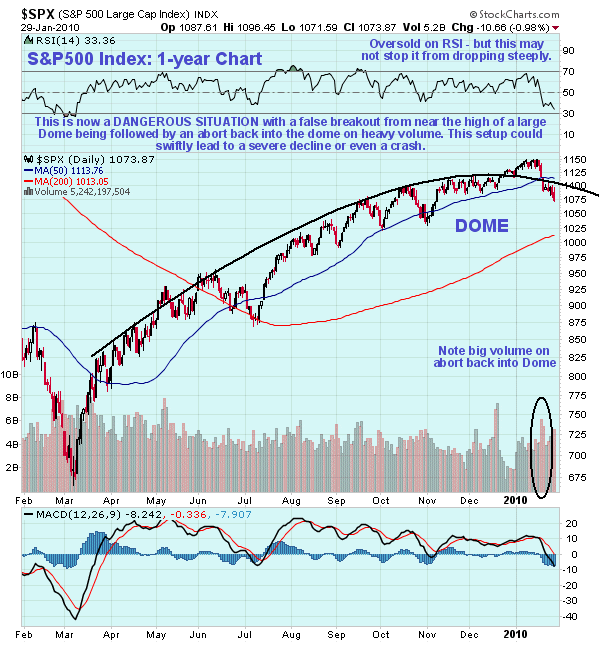
We have seen some highly unusual and deceptive action in the broad US stockmarket. On the 1-year chart we can see that after gradually rounding over beneath a massive "Distribution Dome", it broke out upside from the Dome just before the end of last year and going into this year. Normally a breakout such as this right at the start of the year leads to months of progress, but on this occasion it was clearly a false breakout as it has been followed by a violent high-volume reversal back into pattern, which has very bearish implications. Thus it appears that the false breakout was a trap intentionally set to "suck the last drop of blood" out of the bagholders before the big decline sets in.
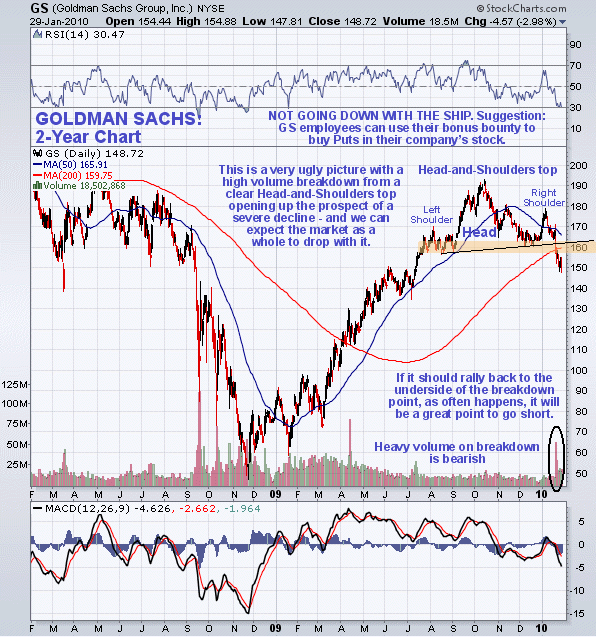
Finally, it definitely looks like the party is over at Goldman Sachs, even if bonus money is still flowing like the mouth of the Amazon. Goldman Sachs and J P Morgan (whose chart is very similar) are the "King and Queen" of Wall St, and if they get taken down they will take the entire Street with them, and as we can see, from the look of Goldman's chart that is exactly what is going to happen. Our 2-year chart shows that it has just broken down on high volume from a classic Head-and-Shoulders top, a development that portends a severe decline, which in the adverse market conditions that are likely to prevail as the second downwave hits, could easily see it back at its late 2008 lows, or even lower.
After rising up to the return line of a high channel, silver broke lower and then plunged precipitously back to support near its 200-day moving average. We saw this coming and sidestepped it a day before the decline started in earnest, although the rise predicted to follow this reaction now looks way too optimistic given the severe deterioration that has set in across most markets, including in particular the copper and PM stock index breakdowns, which is increasing the risk of another deflationary rout.
We have looked at the rapid deterioration in some other commodities, and in the HUI PM stock index and the broad stockmarket in some detail in the Gold Market update and at the outlook for the dollar, and as all of this is of equal relevance for silver as it is for gold, you are referred to the Gold Market update for details.
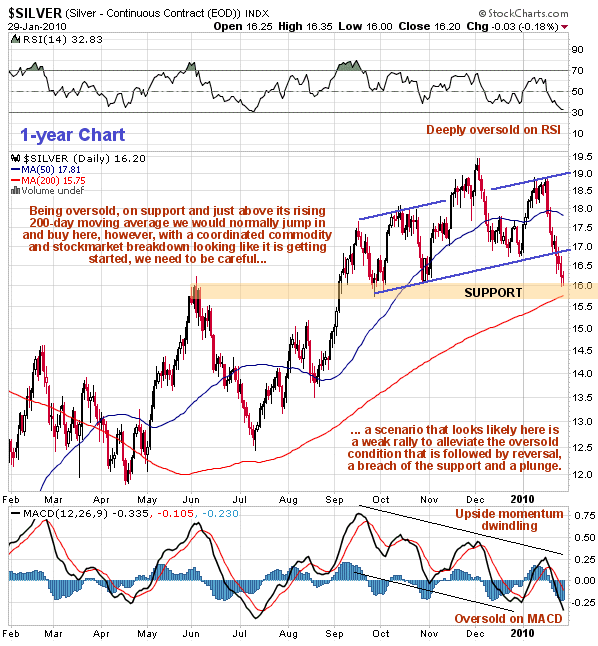
Although the big picture for most markets, including the Precious Metals market, is rapidly worsening, it is clear on our 1-year chart for silver that it is now deeply oversold, as it has plunged from about $18.80 to $16.20 in under two weeks. Given that it has now arrived at a support level that is just above its rising 200-day moving, a short-term bounce looks likely that will serve to alleviate the oversold condition before it probably goes on to crash this support. Such a bounce is unlikely to get very far given the overall bearish tenor of most commodity charts, and a likely target for it would be the $16.80 - $17.00 area. If silver does rise to this area we may short it, depending on how it looks when it gets there, and will certainly consider shorting weaker silver stocks.
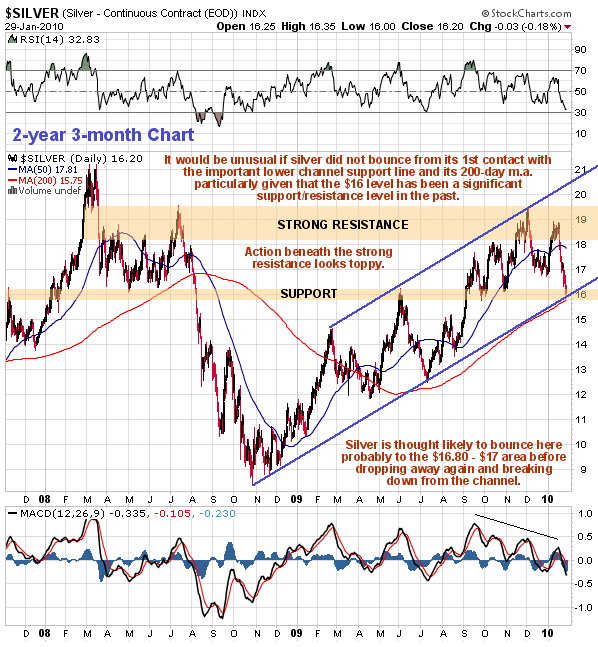
On the 2-year 3-month chart (this timeframe having been chosen to stop the March 2008 peak area being obscured by data), silver appears to be in a fine parallel uptrend channel and to be a buy following the reaction to the lower channel support line. However, it is the bearish behaviour of other markets combined with the toppy looking action beneath the strong resistance shown on this chart that leads us to the conclusion that it is probably destined to break down, although for the reasons outlined above it should bounce before the expected breakdown occurs.
Clive Maund, Diploma Technical Analysis
[email protected]
www.clivemaund.com
Copiapo, Chile, 31 January 2010


