Gold Market Update
In the last update we were looking for gold to turn lower, it did turn lower and dropped quite heavily back to its 200-day moving average. However, it has risen all the way back up again and is now within striking distance of breaking out to new highs.
On its 1-year chart we can see how gold has been rising steadily for 4 straight weeks now to arrive at a zone of substantial resistance approaching its highs. This fact alone makes it likely that it will pause beneath the highs and possibly react slightly before it can break out to new highs. However, we should note that the steady nature of gold’s rise over the past 4 weeks has prevented it from becoming seriously overbought, so that it has the capacity to break out to new highs even now, although a pause to consolidate/react is thought more likely first. Moving averages are very positively aligned, which bodes well for a breakout to new highs leading to a significant upleg over the medium-term.
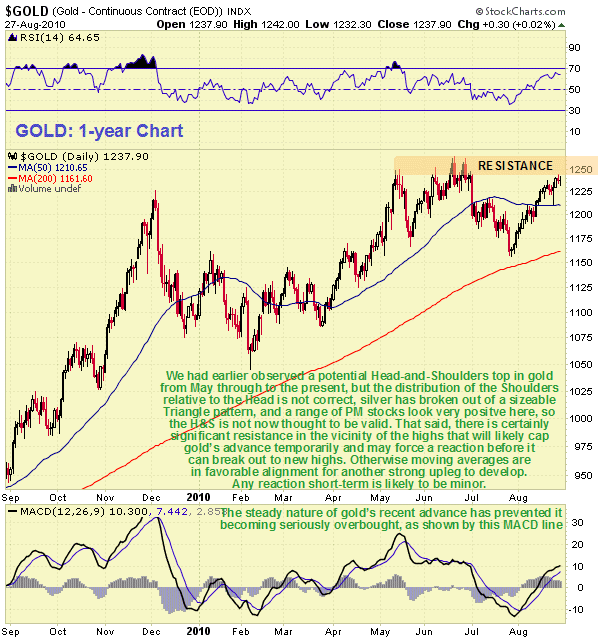
Earlier it had looked like a Head-and-Shoulders top may be forming in gold, especially as silver for a time looked extremely vulnerable, until its sharp breakout last week, but now this danger is thought to have passed, especially as with the chart as it now is, any Right Shoulder in gold would be lopsided and disproportionate. Other evidence suggesting that gold is destined to go on to break out to new highs includes the very bullish appearance of a wide range of individual stock charts, especially those which feature completed Pan & Handle bases, a number of which have been written up on the site over the past couple of days, and also the dollar, which is looking vulnerable here after its recent rally. A further factor that we should not overlook is that September is seasonally the strongest time of year for gold.
Fundamentally, the main case for gold is the outlook for continued debasement of currencies - not just the dollar but most currencies as they compete in a “race to the bottom”. While powerful deflationary forces do indeed lurk beneath the surface, especially in the US, which are manifesting in the form of falling house prices and high unemployment, governments intent on survival and the prolongation of personal positions of privilege, can be expected to attempt to hold them back for as long as possible by means of money creation. This is particularly true of the US where the medicine for massive debt and attendant liquidity problems is more QE (Quantitative Easing), monetization of the Treasury market and suppression of interest rates for as long as they can get away with it. All of this is of course good news for gold and silver prices and commodity prices generally. Silver’s breakout last week, assuming it was genuine, was a sign that deflationary forces, which had come close to forcing another collapse, are being beaten back again.
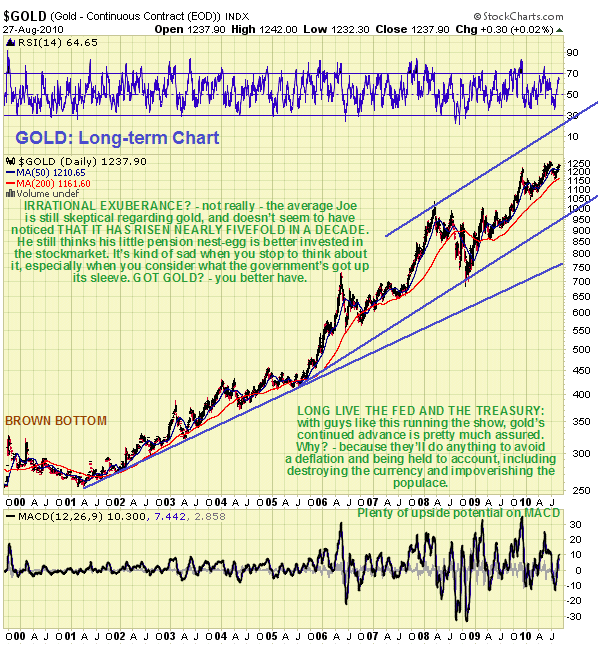
Our long-term chart for gold shows it continuing to march higher with further upside potential at least to the top of the channel shown. Perhaps one of the oddest things about this bullmarket to date is that there has been virtually no public participation, with the ordinary Joe remaining skeptical of gold, even though it has risen by a highly impressive factor of 5 times in 10 years - what does it take to impress him and get him interested, 50 times? - stick around another 10 years and that might not seem so funny.
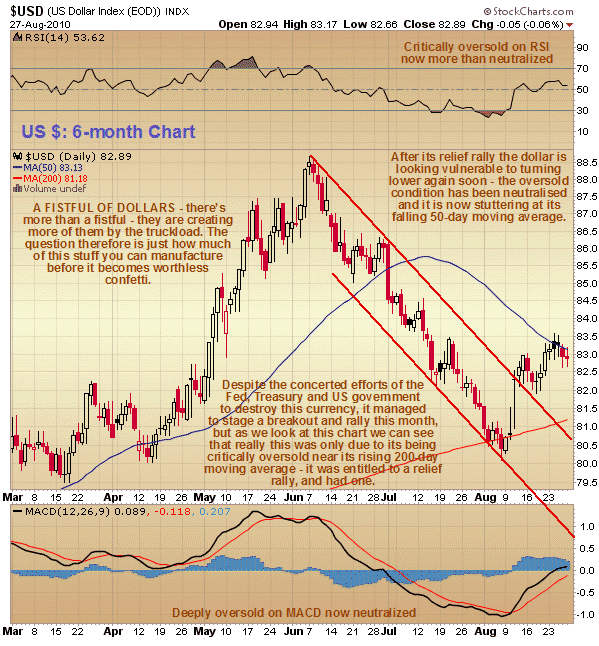
We had earlier thought that the dollar’s breakout from its severe downtrend implied a major reversal, which of course it would have if deflation had gained the upper hand, but now with silver having broken out and gold looking perky, it is looking decidedly fragile and vulnerable here as it stutters near its falling 50-day moving average, so that the recent rally may have been little more than a short covering panic initiated by its being deeply oversold near a rising 200-day moving average and fuelled by panic short covering once the move gained momentum. Thus it is thought that the dollar could go into severe decline again soon, which is logical if the drugged-up patient is going to be administered another heavy does of the Quantitative Easing medicine soon.
 After looking extremely vulnerable for weeks, silver staged an upside breakout last week that has taken the price away from the danger zone and also signaled a probable breakout to new highs that, should it occur after such a prolonged standoff, can be expected to lead to a powerful uptrend that takes the price to a target area in the high $20’s.
On its 6-month chart we can see how on Wednesday silver broke out upside from the Triangle it had been stuck in for months. This is regarded as a genuine breakout because of the way it broke sharply out of the Triangle after weeks of quiet trading, and also because of other factors, such as the positive patterns approaching completion in a range of Precious Metals stocks. If it is genuine then it should not drop back into the Triangle, although it may well react back short-term towards its top line, which would be viewed as a buying opportunity, before it goes on to take out the resistance towards and at its highs around $21. A clear sell signal would only be generated by the price dropping below the bottom line of the Triangle.
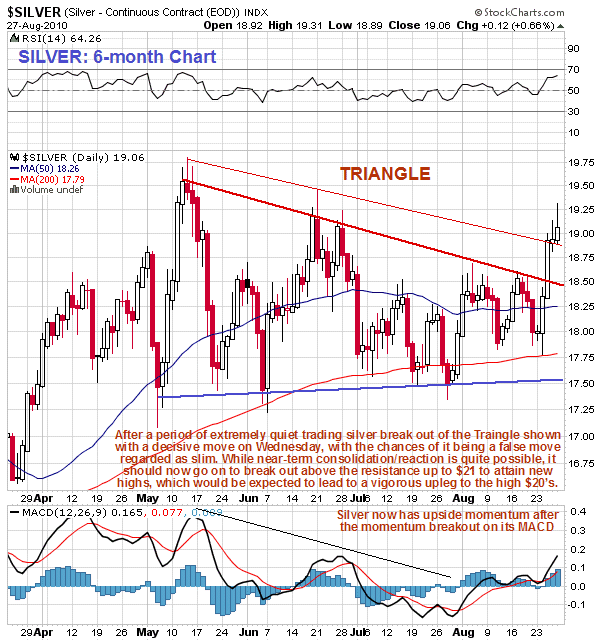
The picture has brightened considerably this month - in July silver had looked decidedly vulnerable, with the price sagging and the 50-day moving average falling above it, and momentum very negative. It could easily have broken down which would have led to a plunge, and the fact that it has instead broken out upside is a strong sign that the lurking forces of deflation are to be temporarily vanquished by the liberal application of hefty doses of newly created money - so easy and convenient when you know how.
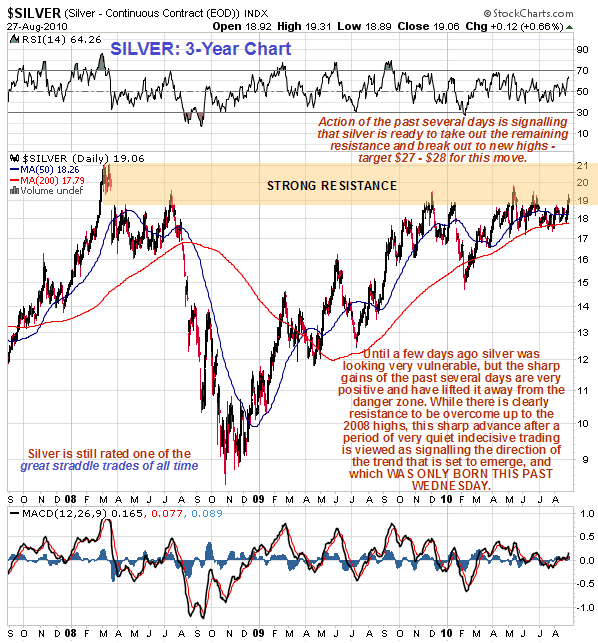
The 3-year chart shows that silver still has some way to go before it breaks out into the clear above $21, but the zone of strong resistance shown up to that level could now be swiftly overcome. This is because silver has been “knocking on this door” for a long time and should therefore have already absorbed most of the overhanging supply. After the prolonged standoff of the past year, a breakout to new highs should lead to a powerful uptrend up to the high $20’s, and the MACD indicator shown at the bottom of the chart which is almost at neutrality certainly provides scope for such a move. In recent weeks we have recommended silver as a “no brainer” Straddle trade on the site, for it is was obvious that after such a prolonged period of going nowhere fast a big move was brewing. At this point it remains a great Straddle trade, especially if it should dip back to the top line of the Triangle in coming days, which would result in the currently inflated Call option prices being slashed.
A reaction back towards the top line of the Triangle in coming days or over the next week or so would certainly be viewed as a silver opportunity to load up on most things silver - silver itself, silver stocks and Call options etc, while stops may be placed below the bottom line of the Triangle to protect from an abort, which could lead to a devastating decline (not now expected). Finally, a factor that we should not overlook is that September is seasonally the strongest time of year for gold and silver.
Clive Maund, Diploma Technical Analysis
[email protected]
www.clivemaund.com
Copiapo, Chile, 29 August 2010


