Gold Market Update - Dollar Soon To Turn Up


All the technical evidence suggests that gold is building out an intermediate top area here, which fits with the fundamental situation where complacency and “risk on” are making a comeback, thanks to the boundless generosity of Central Bankers.
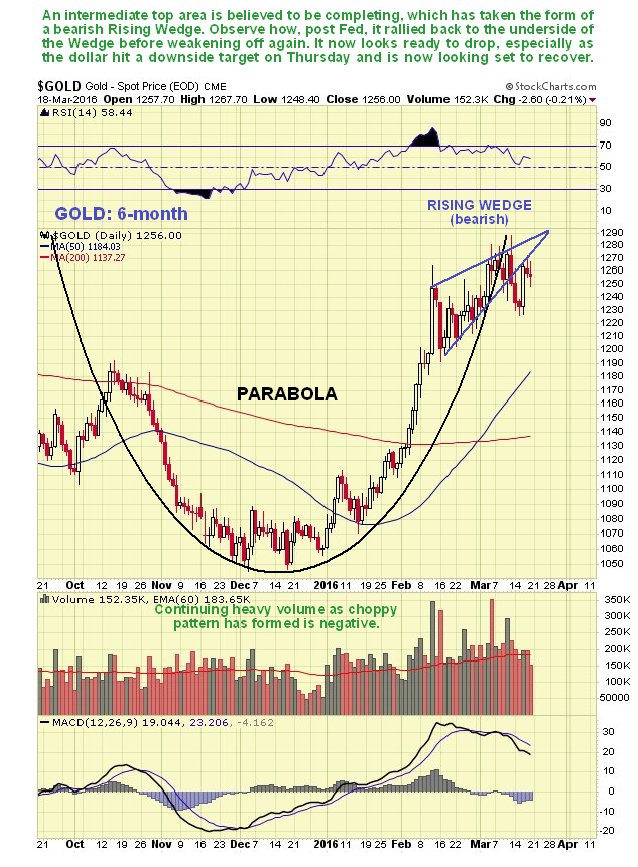
Starting with gold’s 6-month chart we see that after its parabolic ramp up in January and early February, it has been struggling to make further progress. The supposed (by some) bull Flag or Pennant turned out to be false and although it has edged ahead a little, the passage of time has resulted in its breaking down from the parabola simply by moving sideways, which has, unknown to many, opened up the risk of a potentially severe drop. The most plausible interpretation of pattern development since the parabolic blow-off spike in early – mid February is that it is a bearish Rising Wedge, which the price broke down from about a week ago, before a backtest of the breakdown point with the big up day last Wednesday when the Fed didn’t raise rates, which triggered panic short covering. The pattern may also be classified as an upsloping Head-and-Shoulders top, but to avoid clutter we haven’t marked this on the chart. One interpretation that is doing the rounds is that this pattern is the “Handle” of a “Cup and Handle” base, with the parabola being the “Cup”, but this is considered invalid, because the Handle should be downsloping with volume declining, instead of which it is upsloping with continuing heavy volume which is viewed as bearish.
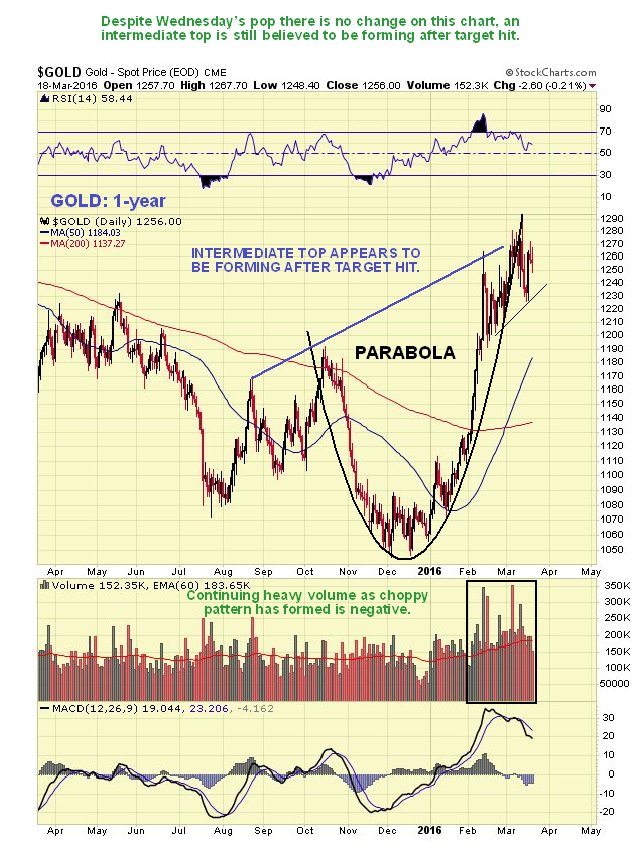
The chief reason for showing the 1-year chart for gold below is so that you can compare it with the latest COT chart shown directly below it, which also goes back a year, but this chart does also reveal that gold’s advance ran into trouble when it slammed into the trendline target shown.
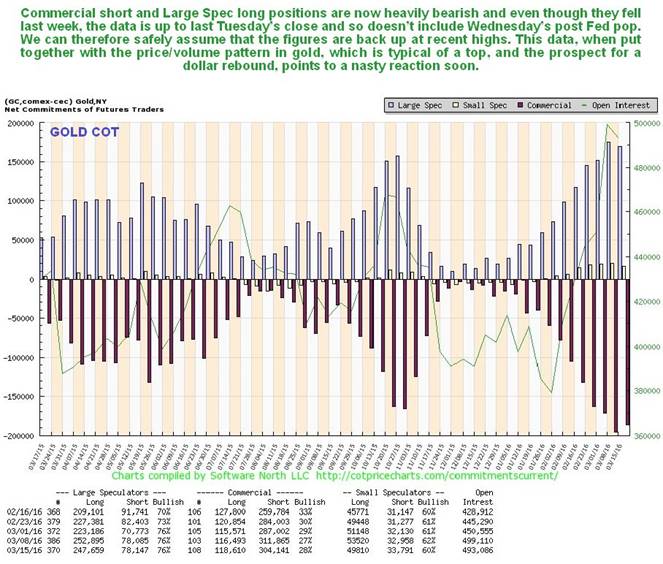
Gold’s latest COT shows that Commercial short and Large Spec long positions are still at a very high level, which is bearish. There was a slight drop last week but we should not be fooled by this – these figures were taken for last Tuesday’s close, when gold had been dropping for 3 days and before it blasted higher on the Fed on Wednesday, so it reasonable to presume that the real readings are back up near or even above the highs. These readings strongly suggest that a sizeable drop is looming.
The latest gold hedgers chart, a form of COT chart, is bearish…
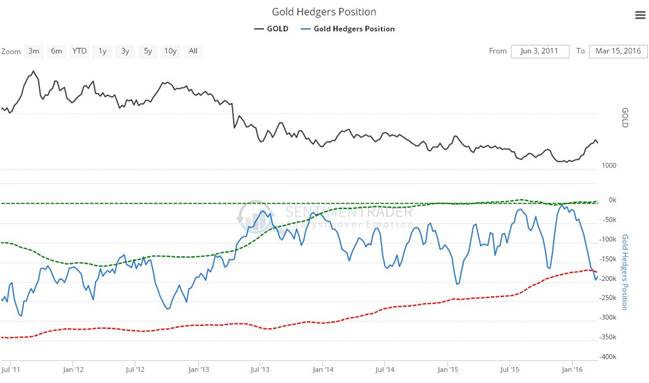
Chart courtesy of www.sentimentrader.com
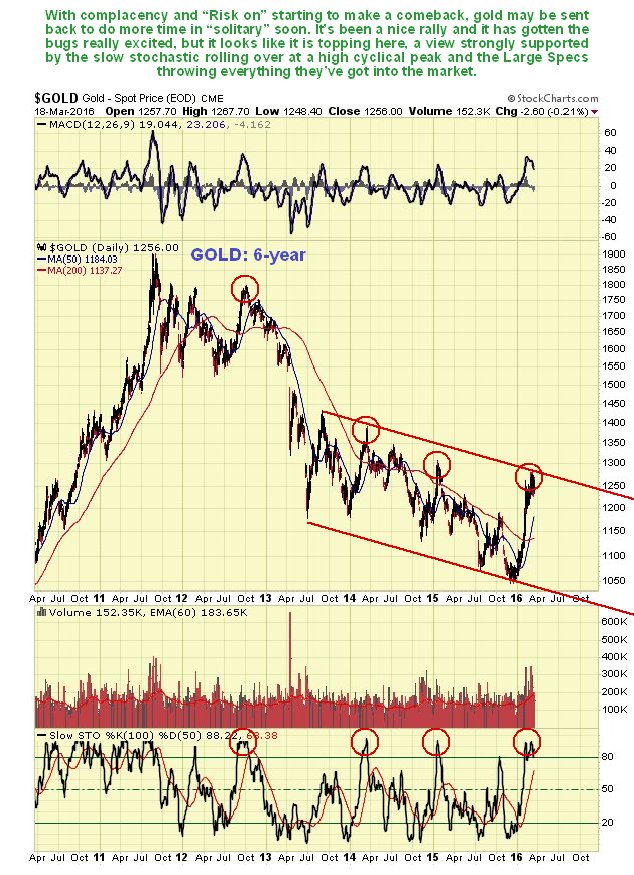
The 6-year chart for gold makes plain that, while gold’s rally from the start of the year has certainly been impressive, it is does not necessarily mark the start of a new bullmarket – it might do, but first it will have to break clear out of the major downtrend shown on this chart, which is has yet to do. Right now it is at a perilous juncture perched at the upper boundary of the major downtrend after a steep rise, with two important factors suggesting that it is likely to get beaten down again, one being the highly unfavorable COT structure that we have just looked at, and the other being the fact that the slow stochastic is rolling over at a high cyclical peak – look what followed after the previous occasions that this happened. Fundamentally there are two negative factors coming into play too – the return of a “risk on” mentality where investors are more interested in the broad stockmarket than in gold and the prospect of the dollar rallying again after hitting a downside target.
The gold Optix, or Optimism chart, is in middling ground and doesn’t give much indication one way or the other…
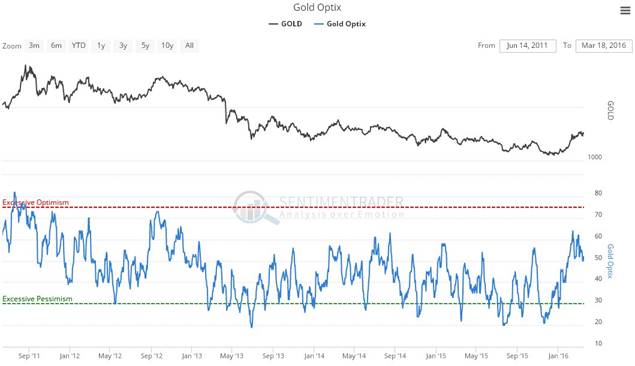
Chart courtesy of www.sentimentrader.com
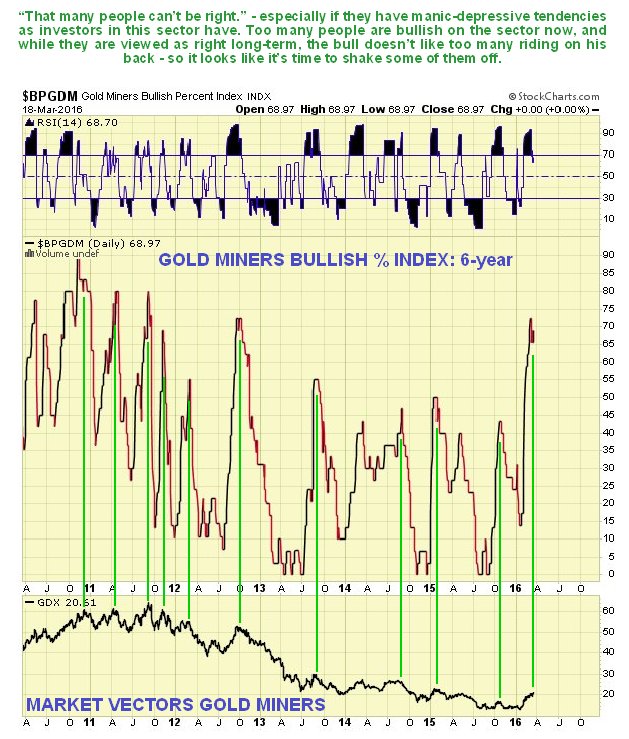
Finally the Gold Miners Bullish Percent Index is at levels normally indicative of a top. By far the majority of investors are bullish on the sector now, which is obviously a sentiment extreme carrying much more downside risk than upside potential.
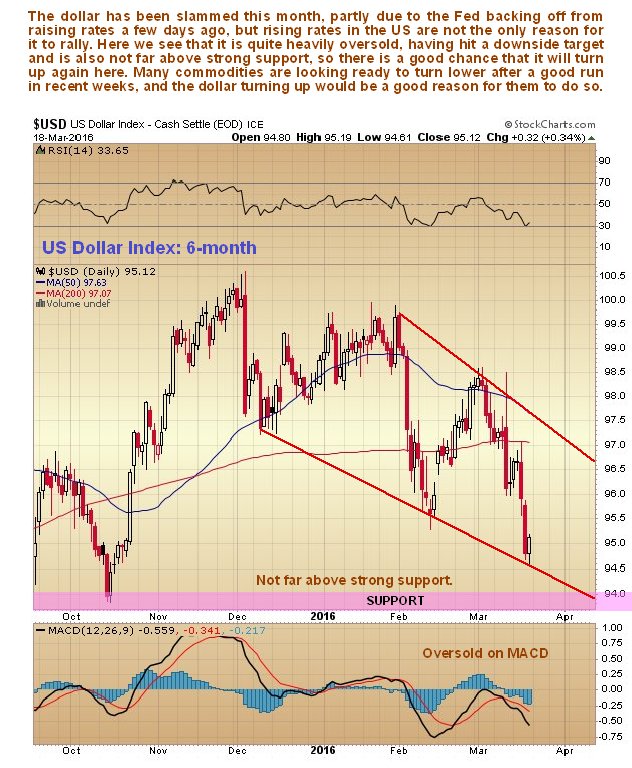
Now we will look at the latest charts for the dollar index. On its 6-month chart we can see that it dropped to arrive at a trendline target on Thursday, following the Fed saying it wasn’t going to raise rates. With the bad news out, and the dollar having arrived at a target not far above strong support in an oversold state, there is a good chance that it will turn higher here – and that the entire commodity complex, which has had a good run on dollar weakness, will now turn lower.
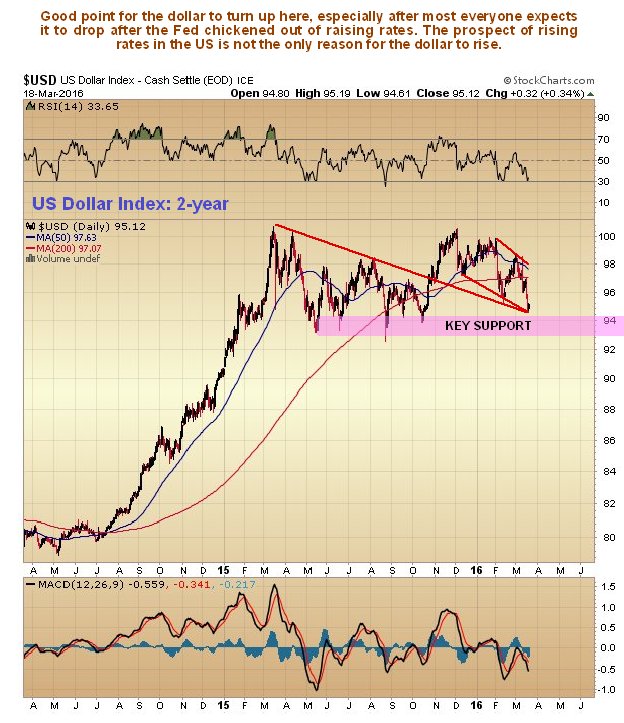
There are other factors besides whether the Fed decides to raise rates or not that will determine the dollar’s trend going forward, with positive factors being safe haven movement into the dollar, and a possible continuation of the carry trade unwind, so it is dangerous to assume that it is “done for” just because the Fed didn’t raise rates. Whilst a break below the key support in the 93 area shown on the 2-year dollar index chart shown below would obviously be bearish, and strongly bullish for gold and silver and doubtless other commodities, the latest COTs for the dollar and especially copper, gold and silver suggest that this is not going to happen, and that instead the dollar will turn up from here, which it is certainly well placed to do.
The conclusion therefore is that the dollar is going to turn up here, or very soon, and that commodities are going to get smacked back down again, especially copper, gold and silver, and oil. Gold in particular is very vulnerable after it recent frothiness and wild excitement among goldbugs.
********
Courtesy of Courtesy of http://www.clivemaund.com

Clive P. Maund’s interest in markets started when, as an aimless youth searching for direction in his mid-20’s, he inherited some money. Unfortunately it was not enough to live a utopian lifestyle as a playboy or retire very young. Therefore on the advice of his brother, he bought a load of British Petroleum stock, which promptly went up 20% in the space of a few weeks. Clive sold them at the top…which really fired his imagination. The prospect of being able to buy securities and sell them later at a higher price, and make money for doing little or no work was most attractive – and so the quest began, especially as he had been further stoked up by watching from the sidelines with a mixture of fascination and envy as fortunes were made in the roaring gold and silver bull market of the late 70’s.
Clive furthered his education in Technical Analysis or charting by ordering various good books from the US and by applying what he learned at work on an everyday basis. He also obtained the UK Society of Technical Analysts’ Diploma.
The years following 2005 saw the boom phase of the Gold and Silver bull market, until they peaked in late 2011. While there is ongoing debate about whether that was the final high, it is not believed to be because of the continuing global debasement of fiat currency. The bear market since 2011 is viewed as being very similar to the 2-year reaction in the mid-70’s, which was preceded by a powerful advance and was followed by a gigantic parabolic price ramp. Moreover, Precious Metals should come back into their own when the various asset bubbles elsewhere burst, which looks set to happen anytime soon.
Visit Clive at his website: CliveMaund.com


