Gold Market Update - How It Will Perform During A Stock Market Crash


2023 has been a year of hiatus (or pause) in the implementation of The Great Reset, at least from the standpoint of the masses who have been able (temporarily) to return to their usual pursuits such as going to sporting events, visiting bars and restaurants and travelling and all without having to wear their “slave masks.” Meanwhile, however, the NWO (New World Order) have been pressing ahead in the background with their agenda, a core element of which is the implementation of the CBDC (Central Bank Digital Currency) system that will see the elimination of cash and as a result all personal freedoms as the control grid now in operation in China will then be rolled out worldwide. They have also given us a dramatic demonstration of how they intend to encourage people to leave their homes in the country and flock to the new “Smart Cities”. They don’t need to bother with a lengthy process of buying people out or offering other costly inducements, they simply burn their houses down in the middle of the night with coordinated arson attacks or DEWs (directed energy weapons) as has happened in Lahaina, Hawaii and across large tracts of Canada. While this action might technically be illegal of course, it won’t stop because they control the justice system and have all the judges in their pockets – there is no law, except the law that serves them.
So, we can see the year 2023 as a lull sitting between two big waves of The Great Reset. The first wave was Covid which centered on lockdowns (Martial Law) and duping or coercing a large portion of the population into rolling up their sleeves to be injected with life-shortening poisons. The next wave, which is imminent, will be more of the same except that this time the justification will be a combination of Covid and the hyped up Climate Crisis, with weather weapons being used, as they have been in the recent past, to create droughts, floods and manipulate hurricanes etc to convince the population that it’s real. A key objective of the next wave of lockdowns, that are planned to be rolled out over the next several months worldwide, will be to finish the job of destroying small independent businesses, with the plunder from the lower and middle classes flowing up the pyramid to the top, as happened during the 1st lockdowns when big stores owned by the NWO were allowed to remain open to funnel the money that would otherwise have been spent in small businesses into NWO coffers. The purpose of all this, apart from simple wealth transfer, is to impoverish the population at large in order to create a state of dependency, that will force the victims into accepting Universal Basic Income (UBI) in order to survive and also the CBDC system. Since cash will be eliminated, those who do not comply by not accepting the use of a digital ID and by not submitting to the injection of poisons into their bodies, will be barred from undertaking financial transactions, barred from entry to supermarkets, and left to starve. This is what is destined to happen if there is not a broad based and robust refusal to comply by the general population.
We have not often talked about the risk of a market crash for a long time. This is because the markets are so distorted by manipulation that “fair value” no longer exists – the Fed in particular is always intervening to head off market declines so that the valuation of the stockmarket bears no relation to the underlying reality – it should be much lower if it reflected the parlous state of the economy. However, there are now several converging factors that make a market crash a lot more likely this Fall. One is that there is a tsunami of Banks that are about to fail making a rurun of 2008 more likely, only worse this time, another is that having gotten their CBDC and UBI systems ready to roll out, the powers that be want to wreck the economy and force the majority of the population into destitution to that they become dependent on the largesse of the State, which is infinite because they simply create as much money as they like, even if only for their own purposes. The playbook looks like it will be similar to what happened in the Spring of 2020, only much worse and if if is we will see a crash phase followed by the Fed (and other CBs) wading in with trillions of newly created dollars to stop the collapse and get things going in the other direction again, but on this occasion the amounts of money that will have to be thrown at the problem will be far greater because the debt bubble is much bigger, and if this is the route they take it will lead to hyperinflation. This is the reason why an initial knee-jerk drop in gold and commodities generally and PM stocks can be expected to be followed by an extraordinarily strong recovery. We will now look at a range of long-term charts to see what history shows us is likely to happen.
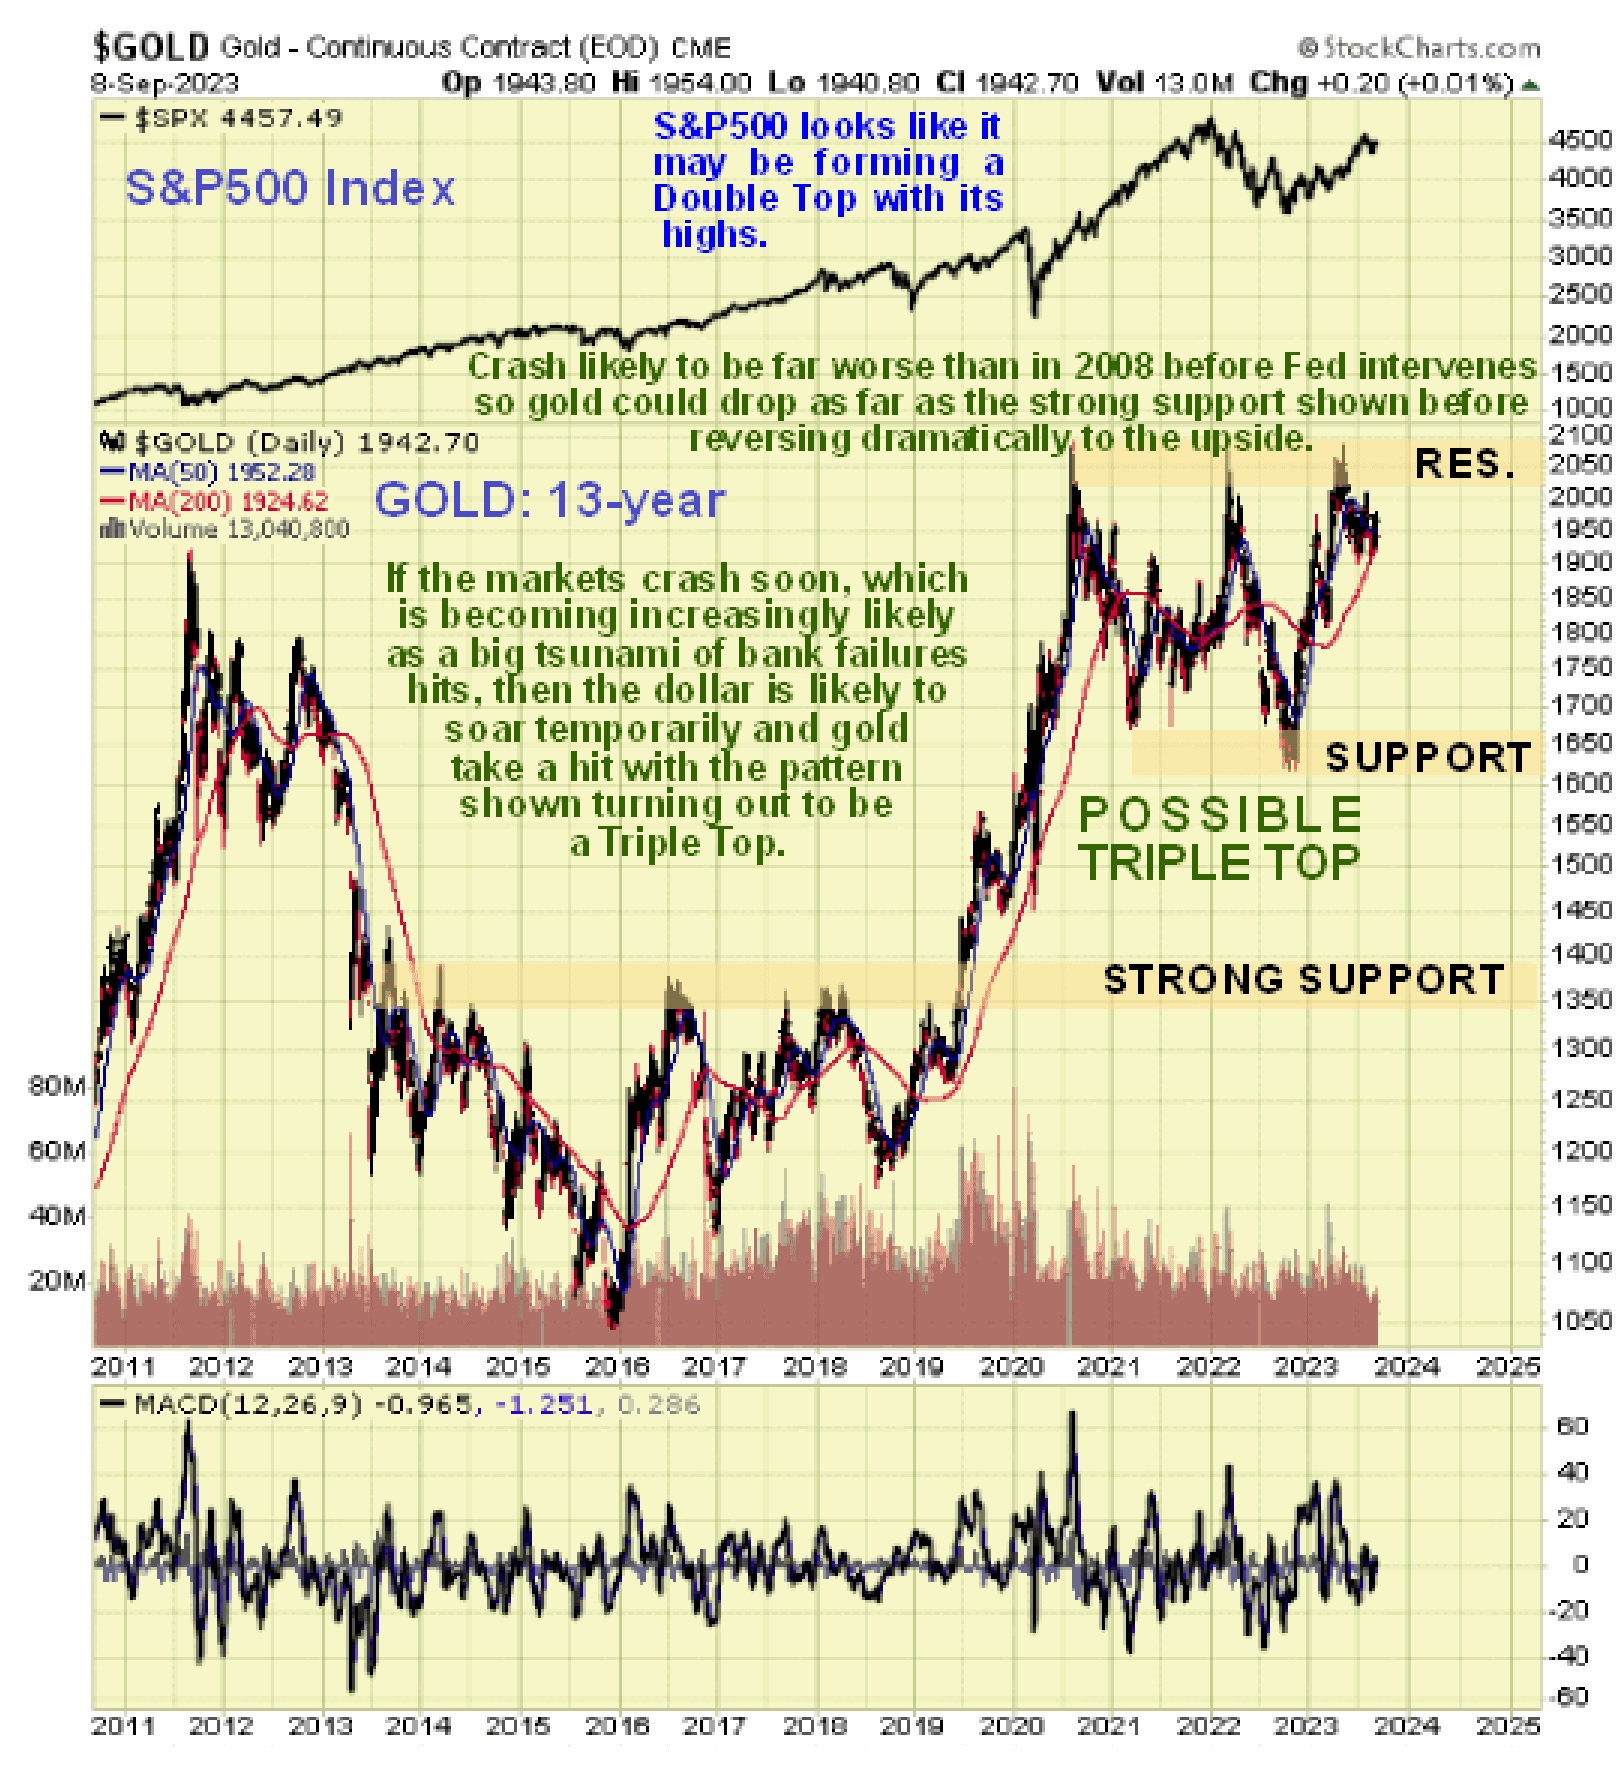
Starting with gold’s long-term 13-year chart, we see that a potential Triple Top has built out at a level not far above the 2011 highs. Could it break out upside from this pattern? – yes it could, but only if the Fed intervenes soon to head off a crash by pumping trillions in to rescue a big raft of failing Banks but for the reasons given above this looks unlikely. If it doesn’t, markets are likely to crash in which case gold should drop initially to the first line of support at the bottom of the big trading range at approximately $1600 - $1650 and then probably breach this support and head lower to the vicinity of the strong support in the $1350 - $1400. Here we should keep in mind that gold can be expected to reverse dramatically to the upside before the stockmarket bottoms, as happened in 2008. The crash is of course likely to be exacerbated by the new round of lockdowns designed intentionally to destroy what is left of small businesses and finish off the middle class. It’s at this point that there will be a clamor of appeals to the Fed and the government to “do something” and they will be only too happy to oblige by creating trillions more dollars out of thin air with which to ride to the rescue, at which point we can expect commodities, including and especially gold and silver, to explode higher.
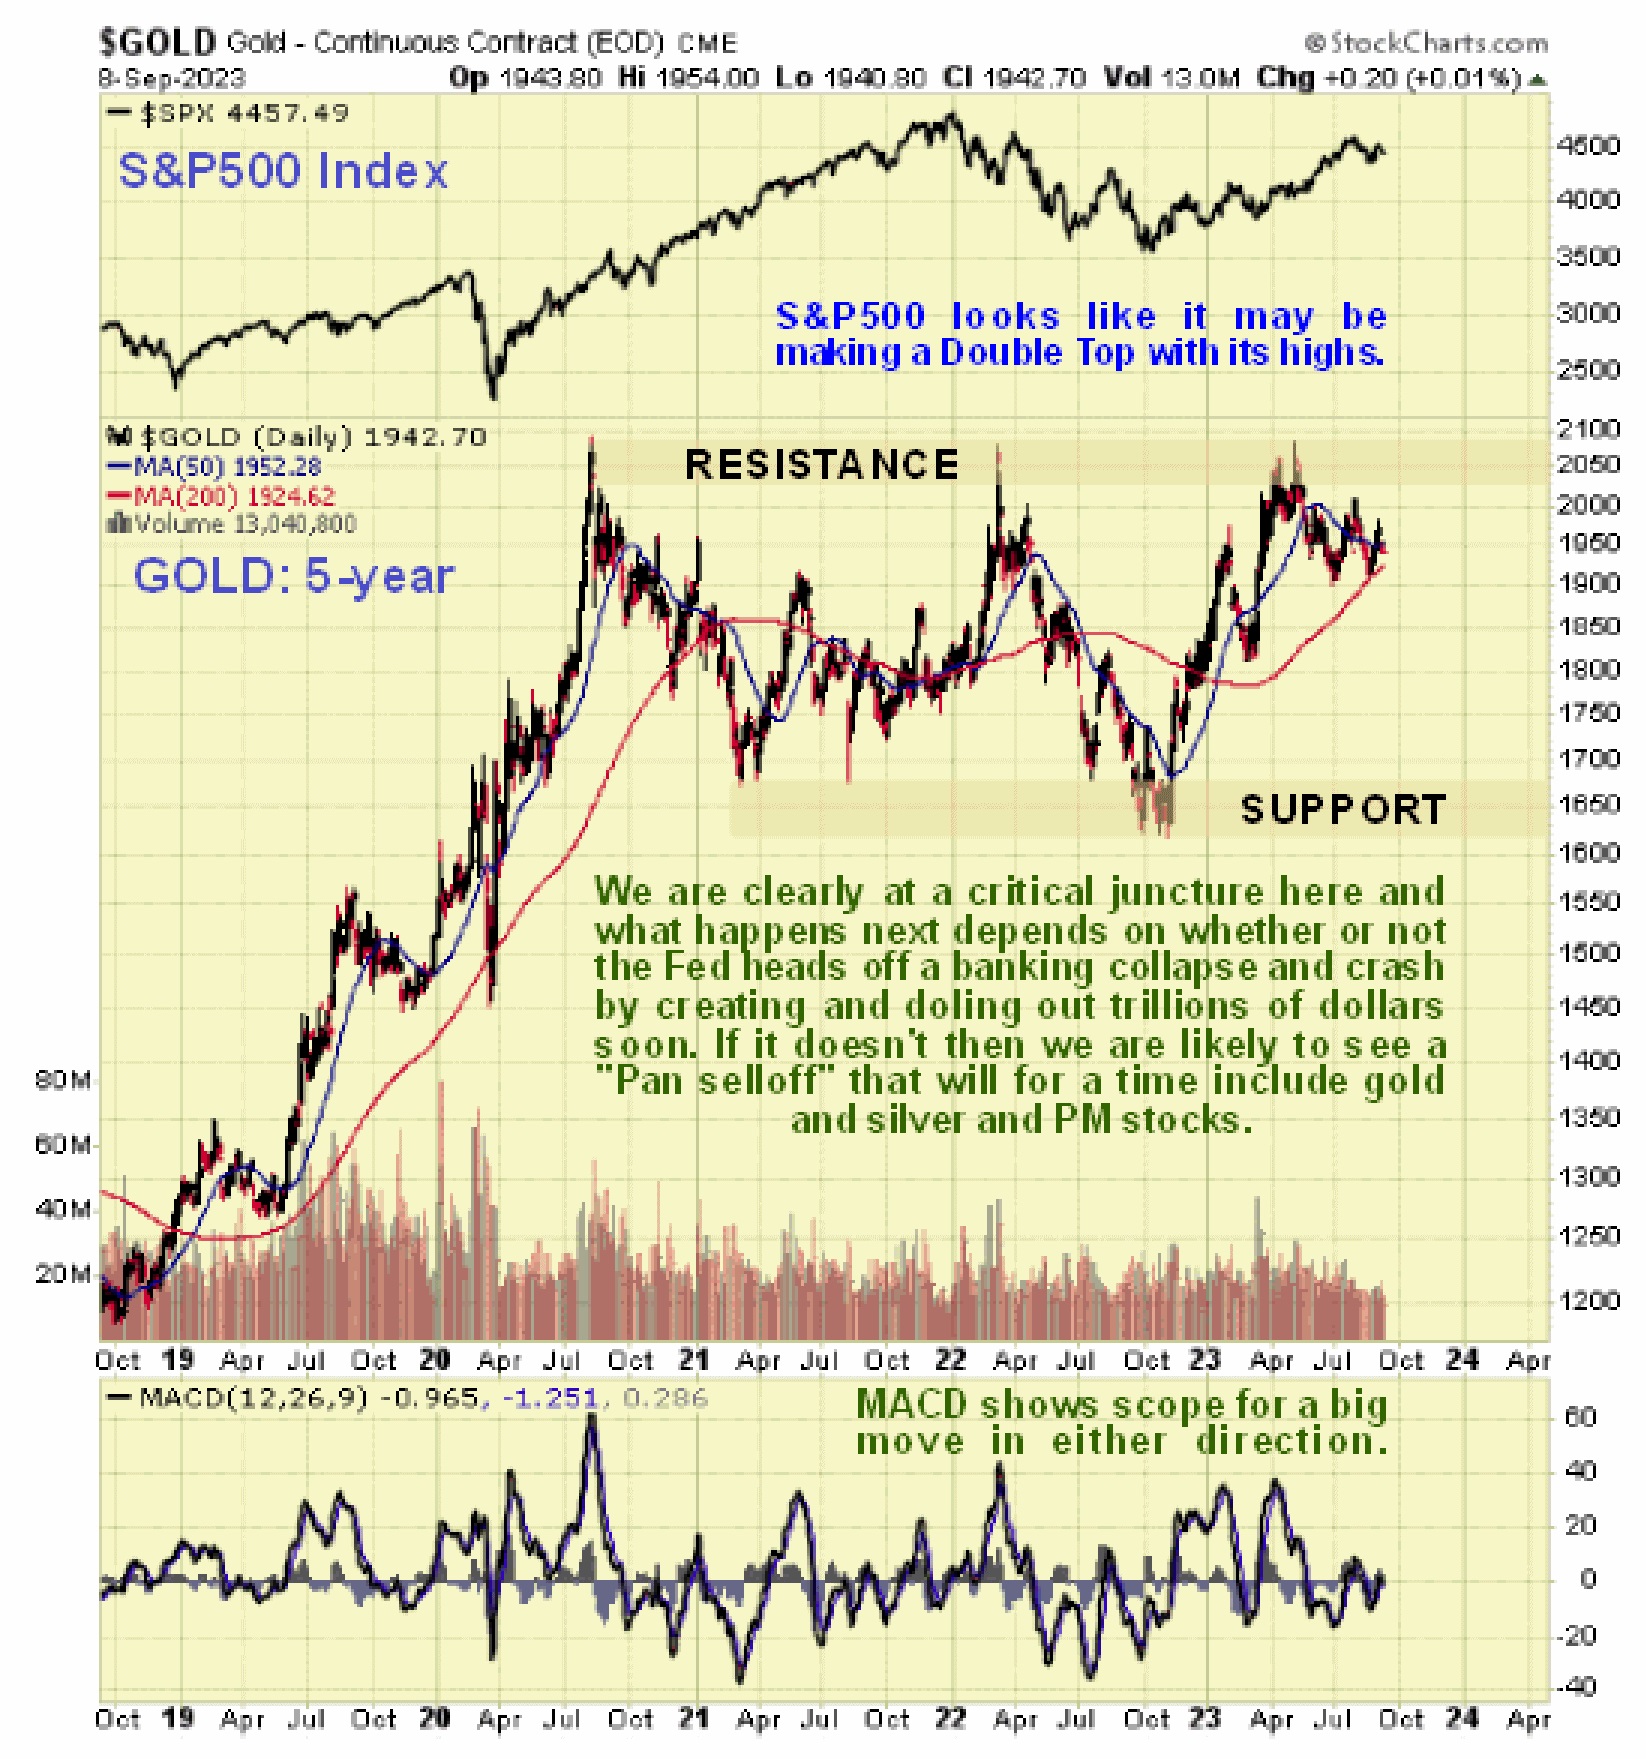
On gold’s 5-year chart we can see gold’s potential Triple Top pattern in more detail and how it is right now at a critical juncture having backed off from resistance at the top of the pattern to its rising 200-day moving average with the confluence of the price and moving averages making a larger move likely soon. We can see how last year and this year it has had a tendency to move in tune with the broad stockmarket (S&P500 Index chart shown at the top) as it did at the time of “Covid Crash” in the Spring of 2020 so if the market drops soon it can be expected to take gold with it.
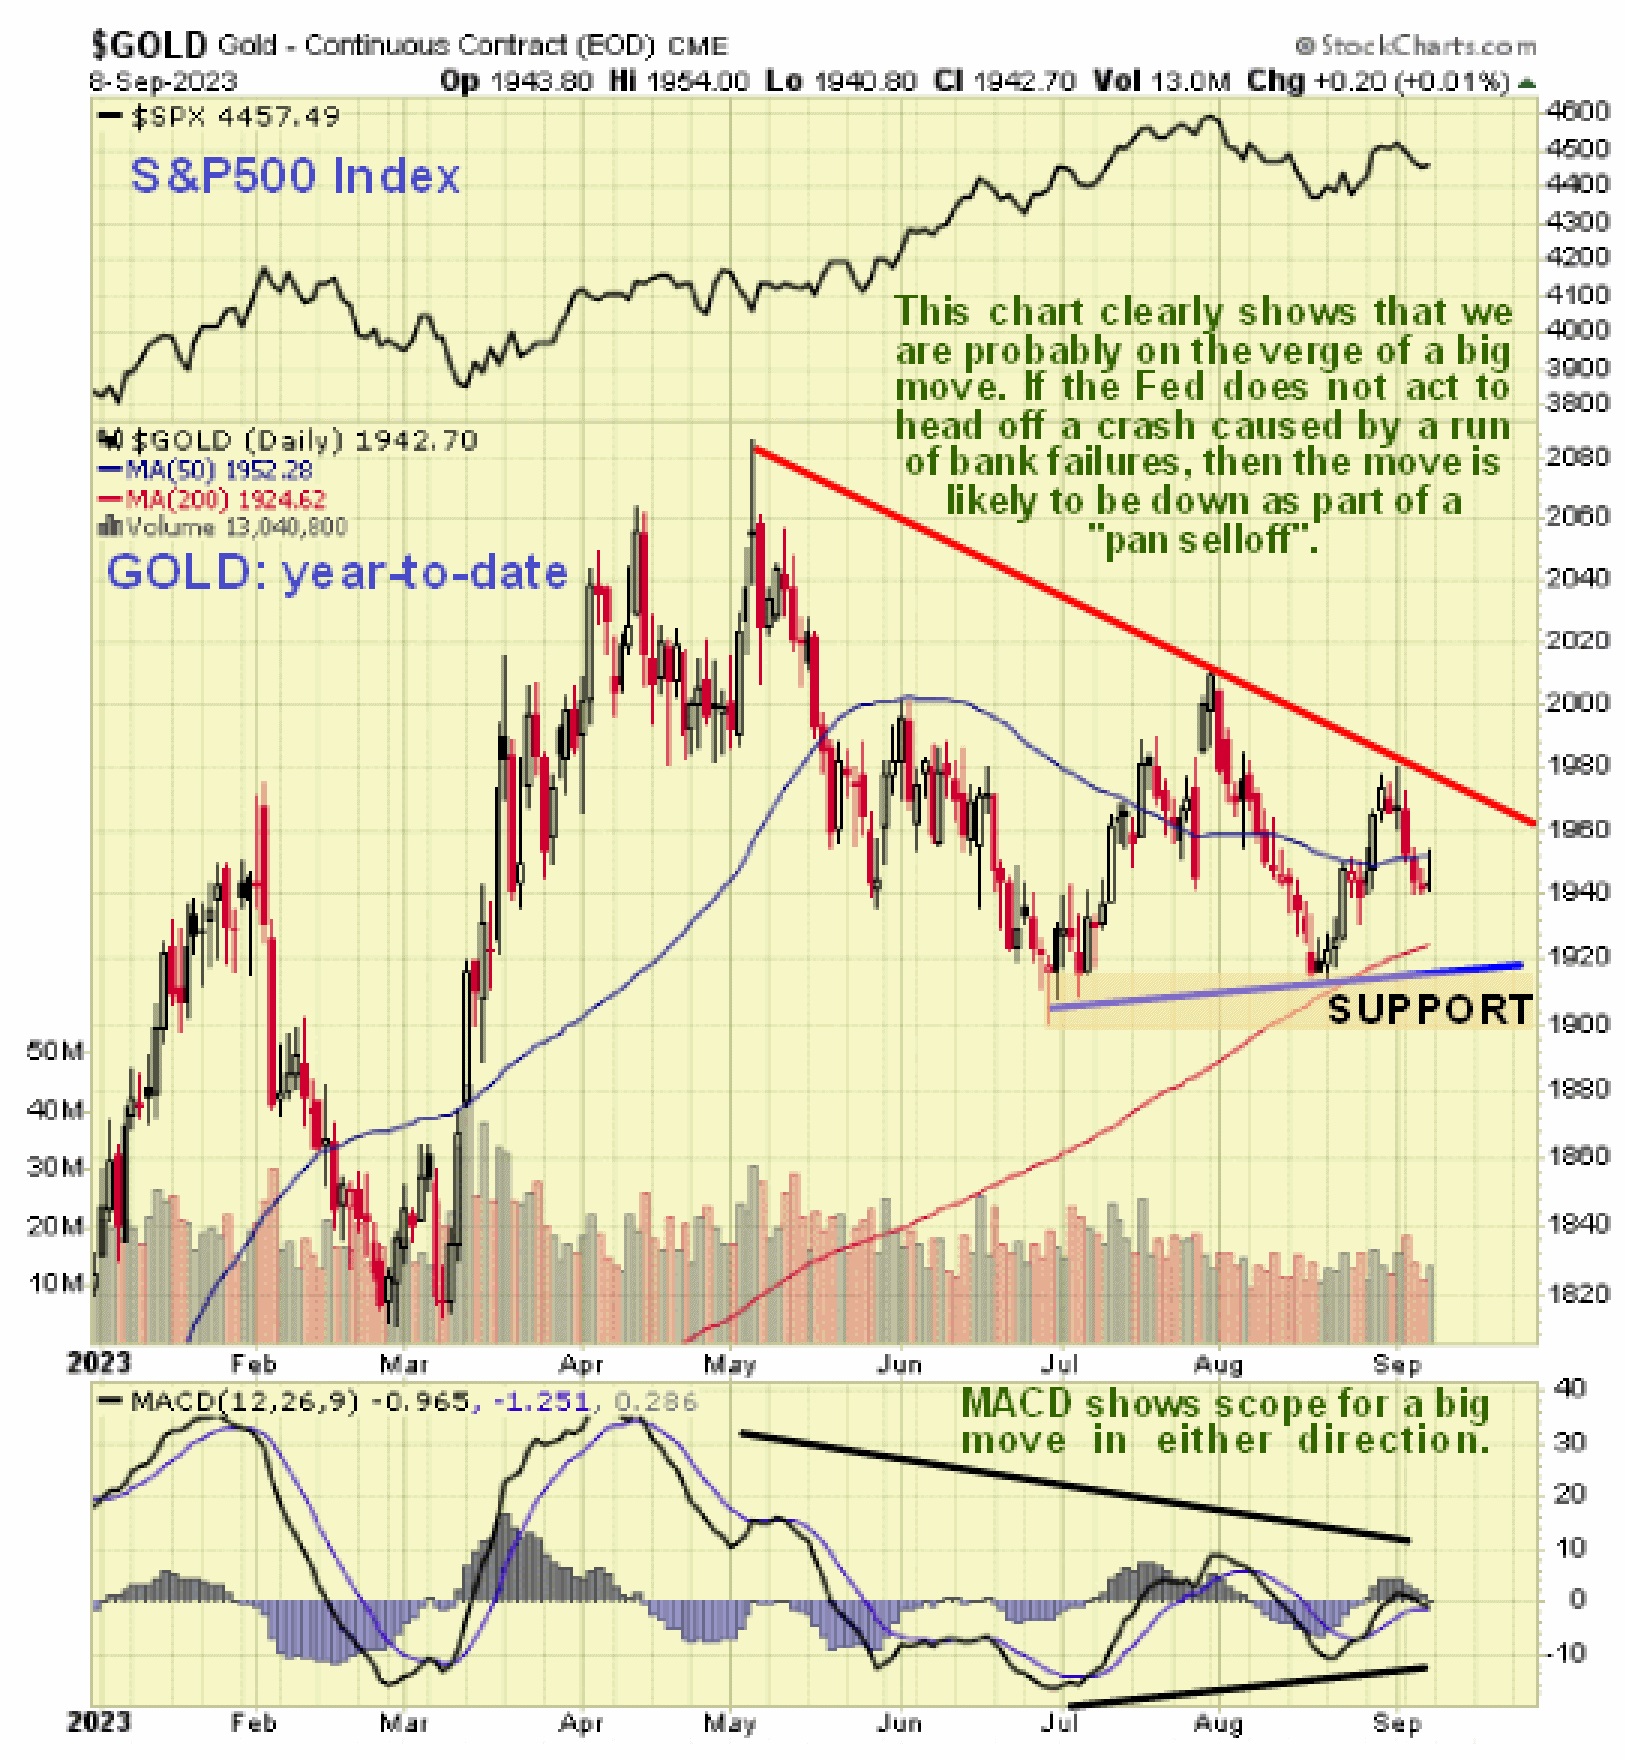
On the year-to-date chart we can see how, having been forced into reverse by the resistance at the upper boundary of the potential top pattern, it has marked out a Triangle and as this Triangle is now closing up with the price and moving averages bunched together in a potent manner, a big move is likely soon, but as mentioned above its direction depends on what what the Fed does, but having said that a market crash looks the most likely scenario in which case gold is likely to break down and drop hard for a while.
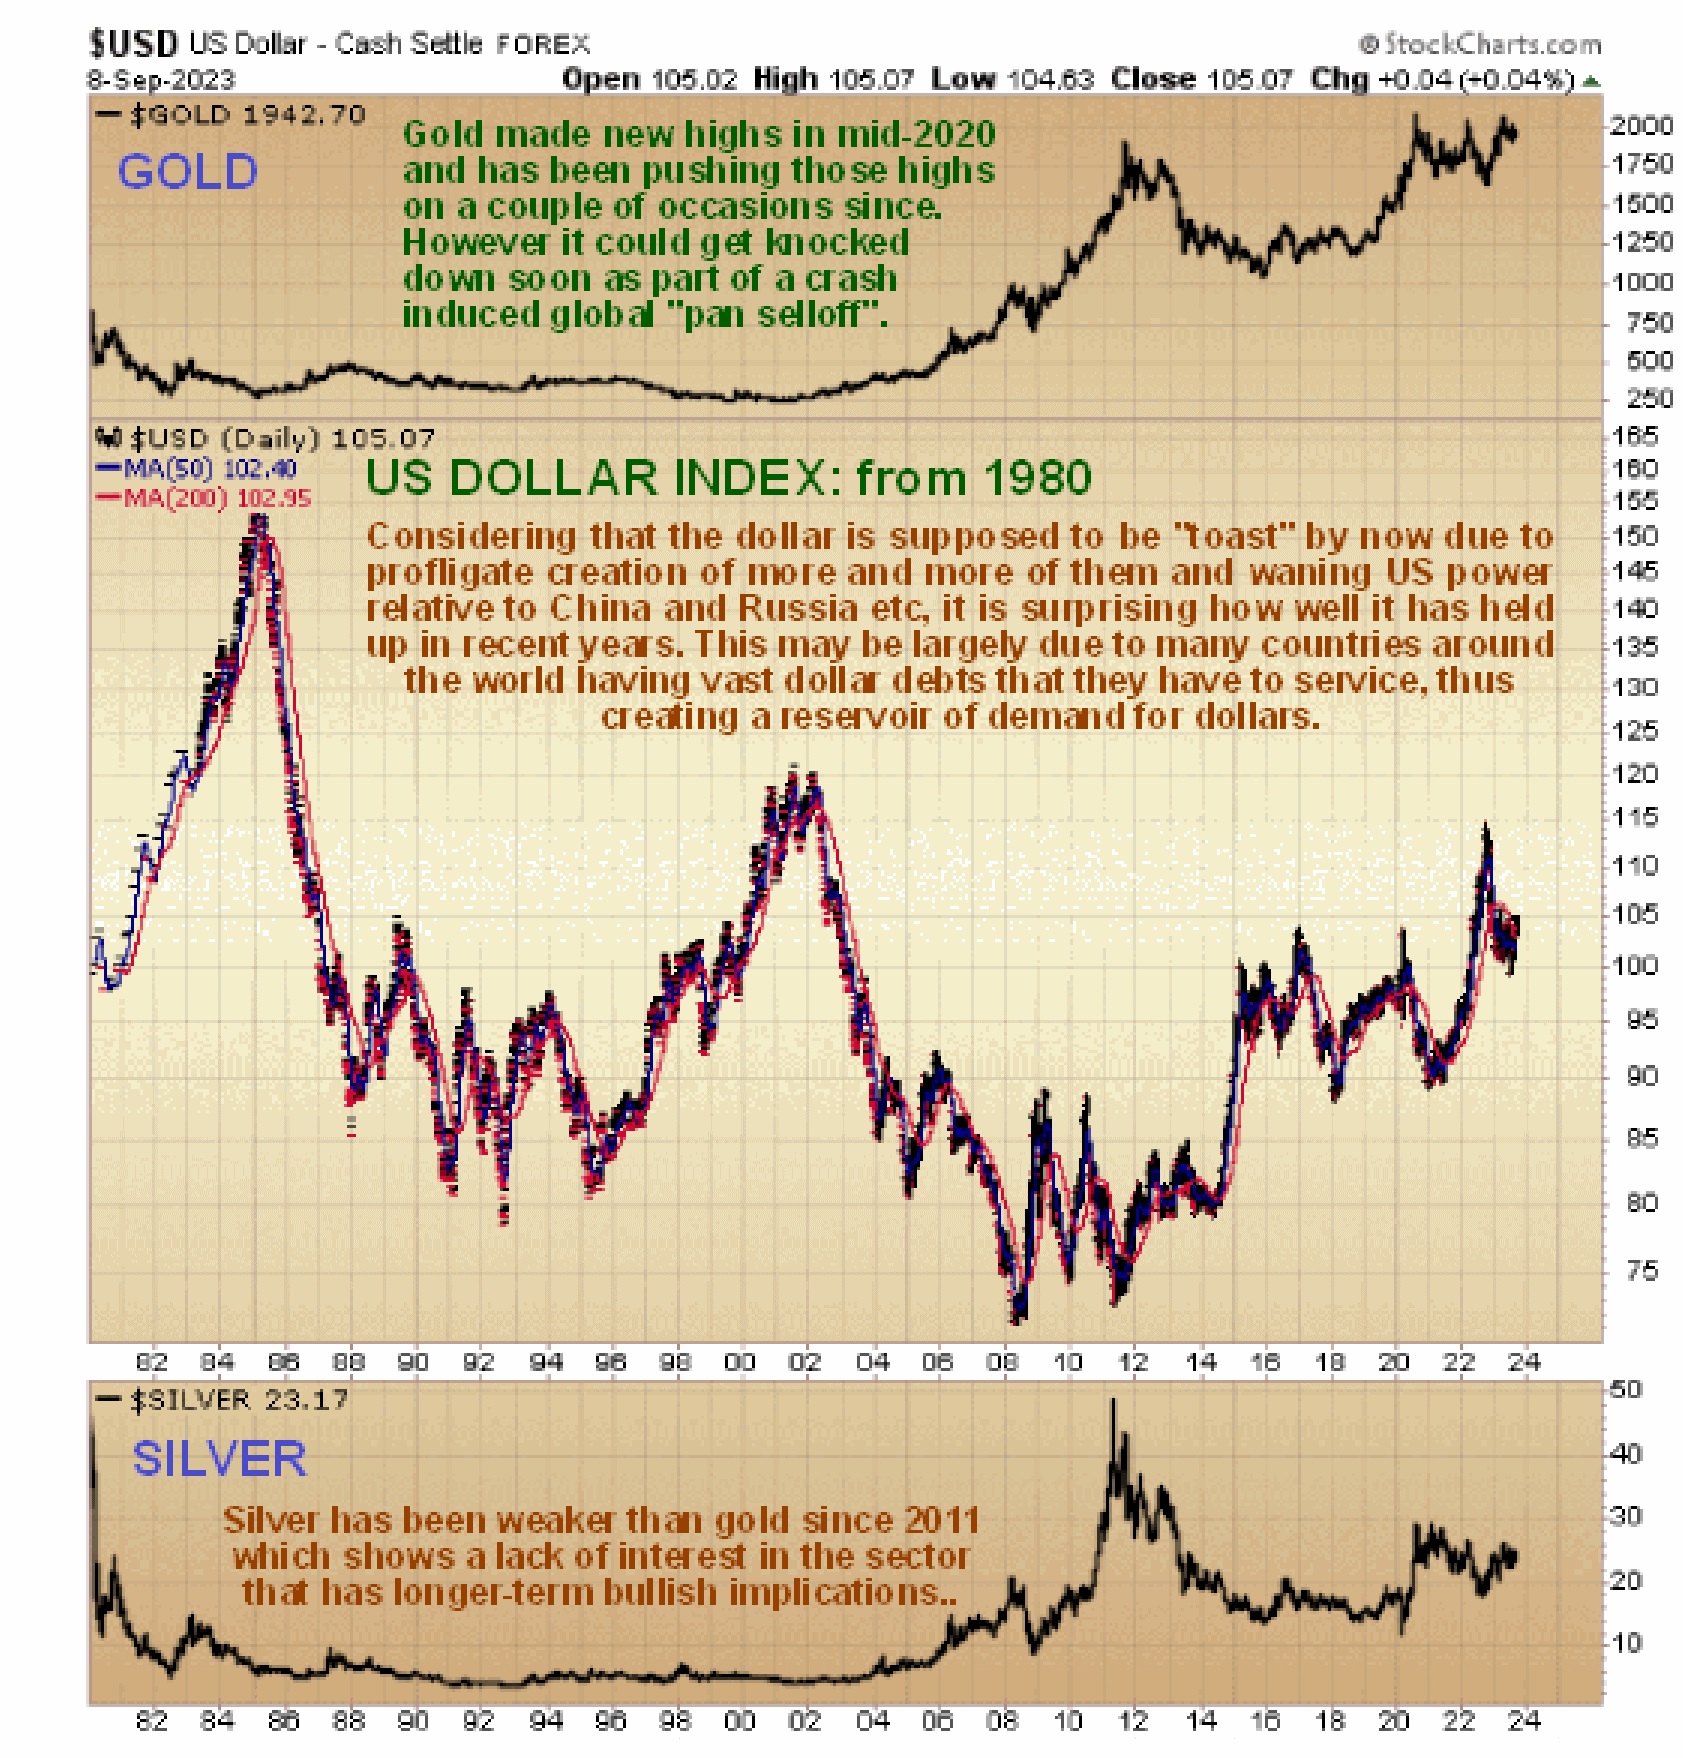
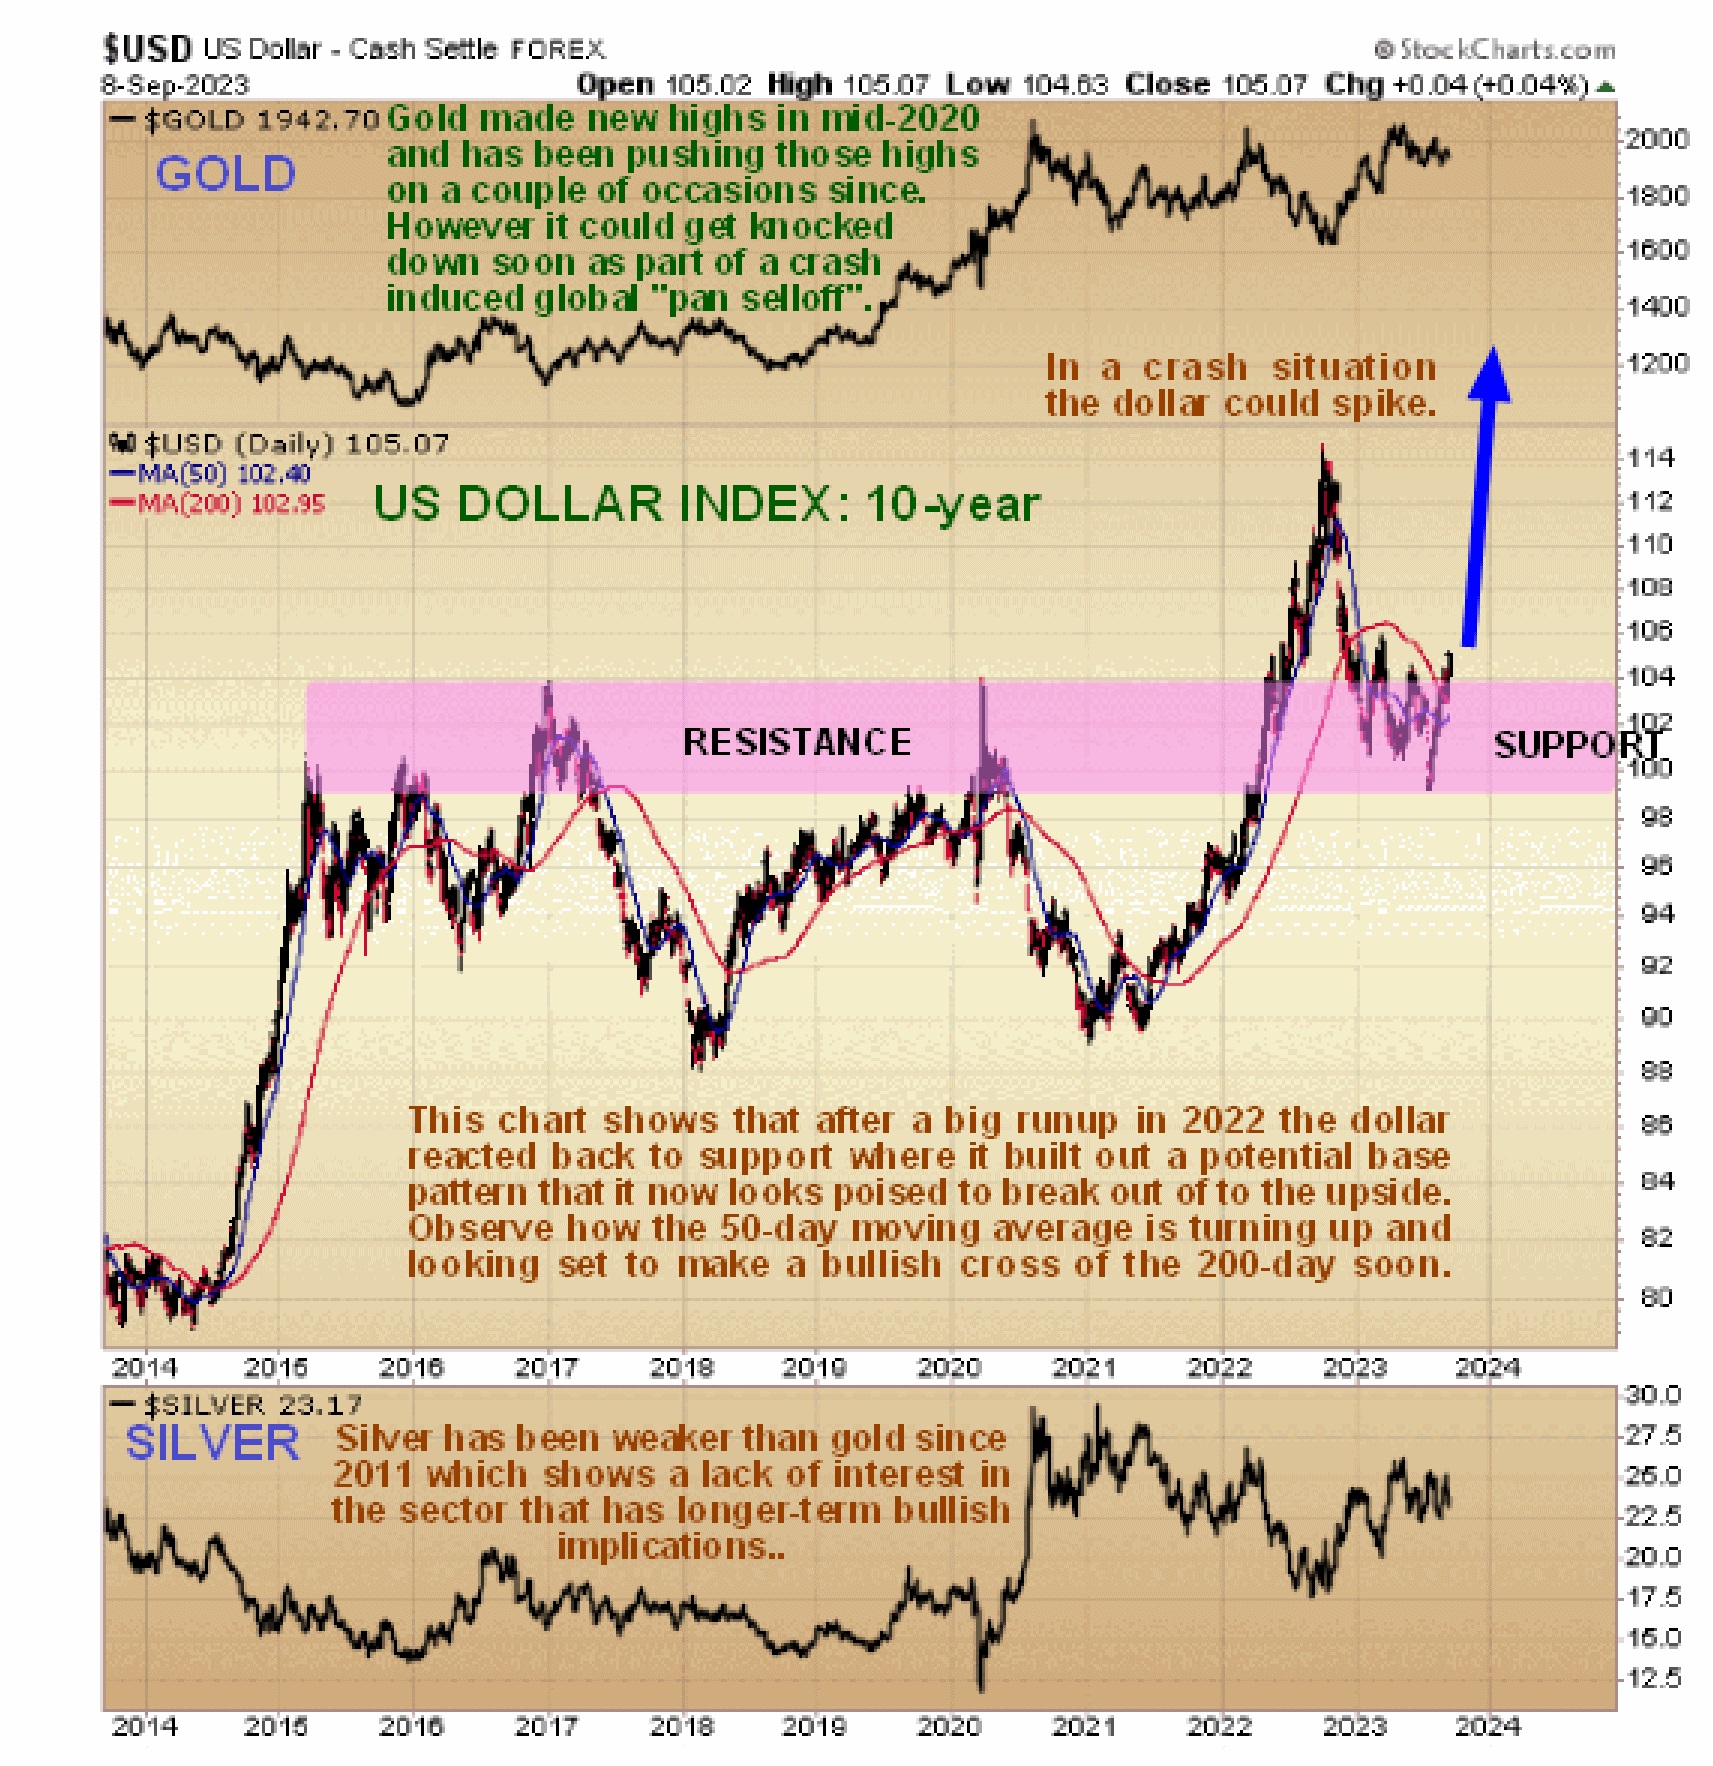
The dollar is of central importance in all this. As you all know it has been “written off” in the recent past due in part to the BRICS moving more to center stage, but it refuses to lay down and die – why? The reason is thought to be that many countries are up to their eyeballs in dollar debt, the servicing of which is creating ongoing demand for dollars. On the dollar index long-term chart going back to 1980 it doesn’t look too bad at all, so far at least. The index is still way above its lows of 2008 and 2010 and is even looking rather robust. Before leaving this chart, compare the gold and silver charts at the top and bottom of it. Silver has underperformed gold since the 2011 peak, which has longer-term bullish implications for the sector because when investors are fearful towards the sector they favor gold over silver and it is out of such pessimism that new bullmarkets are born.
The dollar looks better still on its 10-year chart on which we see that, following a powerful runup during the early part of 2022, it reacted back to a broad band of quite strong support at the upper boundary of the big trading range that started to form early in 2016. It has stabilized at this support and built out a potential base pattern from which it now appears to be beginning a new uptrend which could of course be powered by “funk money” flooding out of the equity markets into the dollar in order to seek safe harbor in short expiry Treasuries, exactly as happened in 2008 which generated the brief but substantial spike that we can see on the chart from 1980 above.
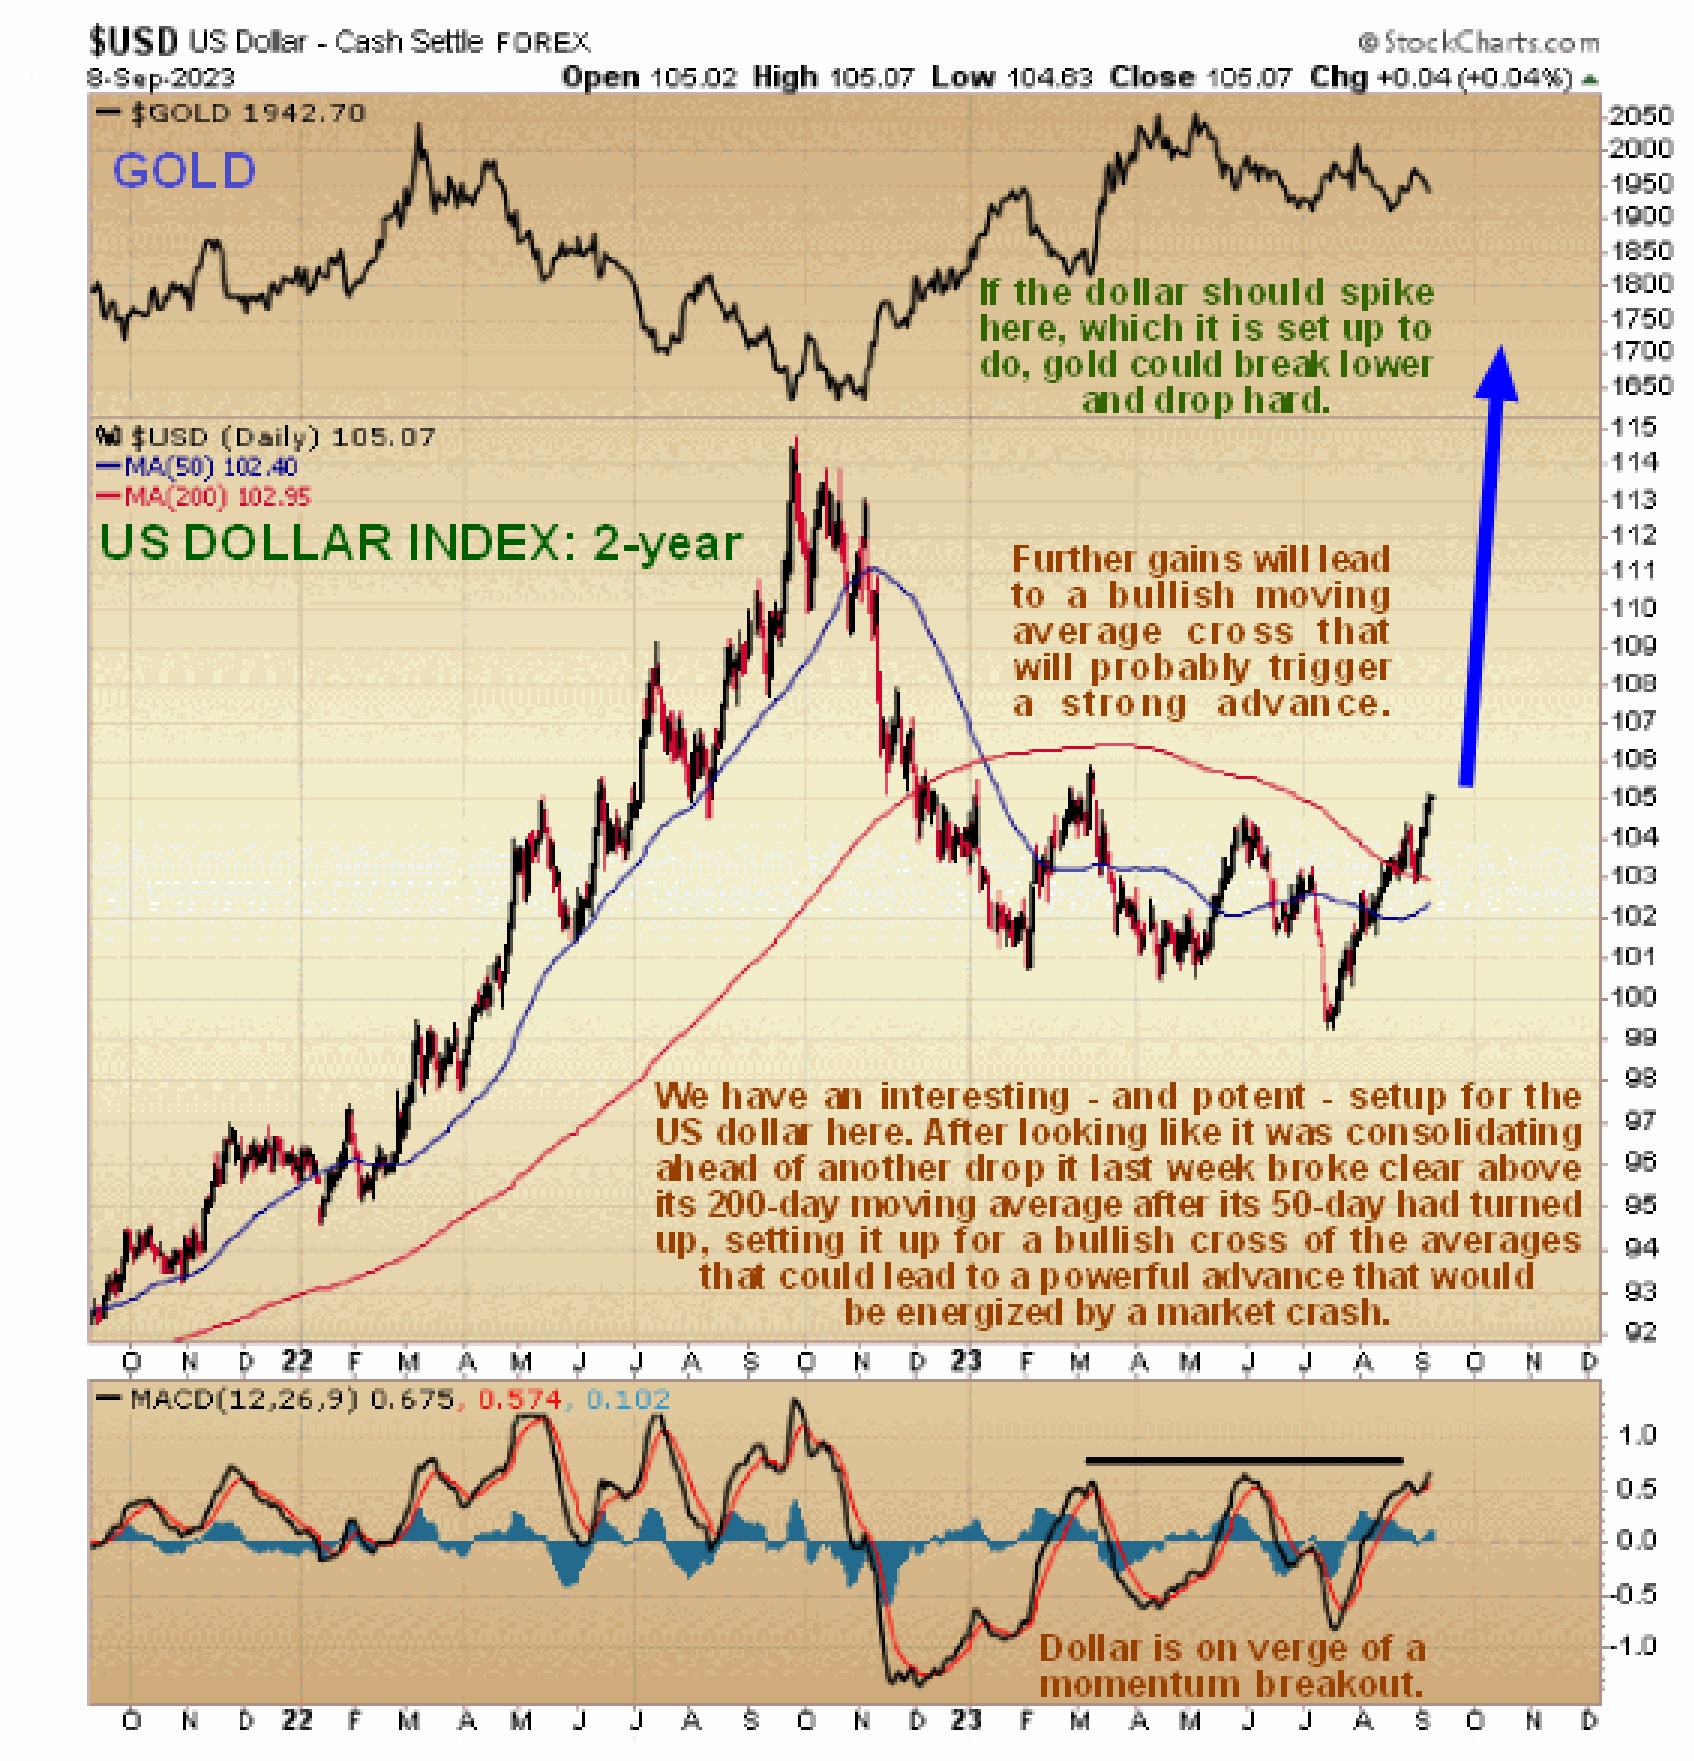
The 2-year chart for the dollar index is useful as it shows us how it looked like it was breaking to lower levels again in July but this move proved to be a “head fake” as it reversed dramatically to the upside and has since risen quite steeply to the extent that it has now (last week) broken clear above its 200-day moving average resulting in the 50-day turning up so that it is threatening to break above the 200-day, the so-called “Golden Cross” that would likely mark the start of a vigorous rally in the dollar as markets crash. You will see also that the dollar has broken above a line of descending peaks from the one in March and is now very close to making a momentum breakout (MACD).
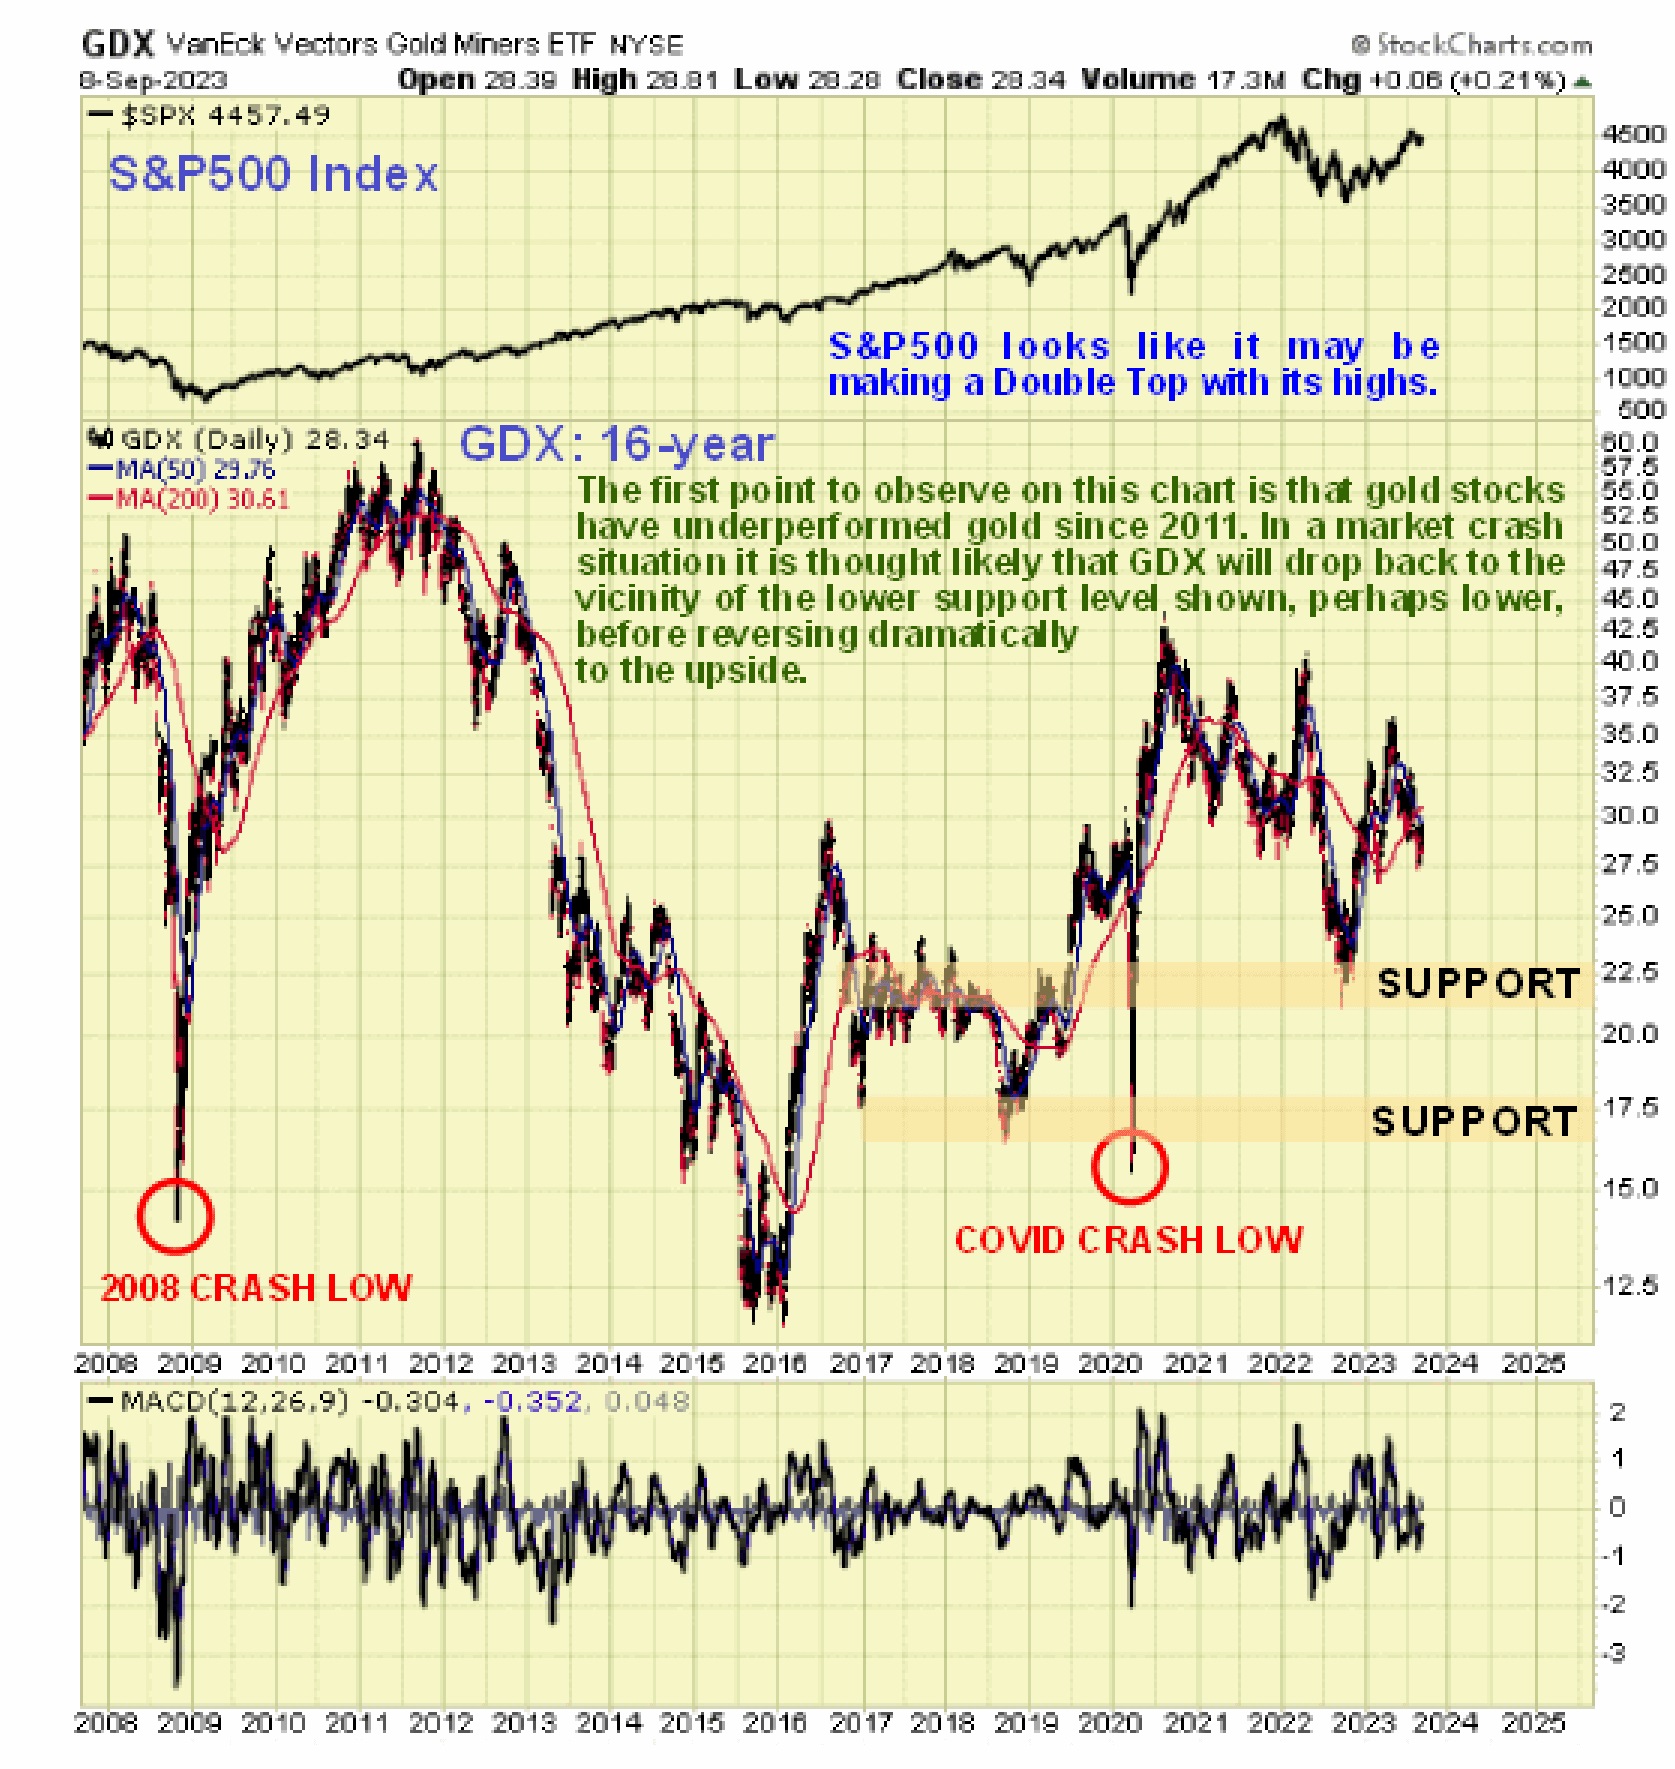
We will end this update by taking a (sobering) look at the 16-year GDX chart to see what happens to PM stocks during market crashes. As the crash of 2008 and the Covid Crashlet of Spring 2020 make clear they get trashed, but the ensuing recovery is big and fast, and that will be even more the case this next time, since the creation of trillions of more dollars to reverse a market crash will lead to hyperinflation.
It is important to keep in mind that although gold, silver and PM stocks tend to drop steeply during the vertical crash phase of stock bearmarkets and bounce back strongly before they end, overall gold does not suffer greatly and sometimes even makes substantial gains as the following chart from gold-eagle.com makes plain. The source page for this chart with commentary may be viewed on the Gold-Eagle webpage entitled Gold Prices During Stock Market Crashes.

Chart courtesy of gold-eagle.com
From all the foregoing the tactics for handling this situation should be obvious. Apart from special situations like Volt Lithium that we have recently been playing with and still are, the choice is either to stand aside, to place stops at strategic levels or to buy Puts as protection and a good vehicle for this purpose is the the SPDR S&P500 ETF, code SPY because it has good liquidity and narrow spreads. Puts used in this manner should not be regarded as speculative, they are insurance and if you buy a near expiring series and it expires worthless, you don’t complain, you simply roll into a later expiry. After all, if you pay for home insurance, you don’t complain if you don’t get to use it because your house hasn’t burned down by the end of the month. With respect to this householders, especially those living in rural areas, should check that their home insurance policy does not exclude damage or destruction caused by DEWs (directed energy weapons) which are “all the rage” now. Ideally you will want to have a reasonable percentage of your assets in cash now so that in the event of a crash as described you will be in a position to move in and scoop up incredible bargains across the PM sector.
**********

Clive P. Maund’s interest in markets started when, as an aimless youth searching for direction in his mid-20’s, he inherited some money. Unfortunately it was not enough to live a utopian lifestyle as a playboy or retire very young. Therefore on the advice of his brother, he bought a load of British Petroleum stock, which promptly went up 20% in the space of a few weeks. Clive sold them at the top…which really fired his imagination. The prospect of being able to buy securities and sell them later at a higher price, and make money for doing little or no work was most attractive – and so the quest began, especially as he had been further stoked up by watching from the sidelines with a mixture of fascination and envy as fortunes were made in the roaring gold and silver bull market of the late 70’s.
Clive furthered his education in Technical Analysis or charting by ordering various good books from the US and by applying what he learned at work on an everyday basis. He also obtained the UK Society of Technical Analysts’ Diploma.
The years following 2005 saw the boom phase of the Gold and Silver bull market, until they peaked in late 2011. While there is ongoing debate about whether that was the final high, it is not believed to be because of the continuing global debasement of fiat currency. The bear market since 2011 is viewed as being very similar to the 2-year reaction in the mid-70’s, which was preceded by a powerful advance and was followed by a gigantic parabolic price ramp. Moreover, Precious Metals should come back into their own when the various asset bubbles elsewhere burst, which looks set to happen anytime soon.
Visit Clive at his website: CliveMaund.com


