Gold Market Update - Renewed Advance Imminent As Central Banks Create More Cash To Shore Up Debt Market...


The debt market has been perilously close to locking up in recent months which would quickly lead to the entire financial system freezing and banks slamming their doors and ATMs not working etc. This is the reason for the heavy selloff across markets that has also affected commodities and driven the dollar higher. So Friday’s announcment that the ECB is to engage in “unlimited bond buying” to stabilize the debt market was a major positive development for markets because other Central Banks, including and especially the Fed, are expected to follow suit which will get markets “off the hook” over the short to medium-term. However, this action will only buy time because the debt monster is now so big that the quantities of money required to feed it are gargantuan and because this requirement has grown exponentially it has now gone vertical, which means that we are in the end of the end of the endgame, so after this final spectacular blowoff that will lead to hyperinflation, credit markets will fly apart anyway as this latest fiat experiment comes crashing down into a smoldering heap of ruins. It’s at this point that they will roll out their new digital money system, which will involve a Chinese style social credit score system and digital passport etc., and if you don’t obey their rules, such as being fully “vaccinated” you will be shut out of it. This will be the means by which they force compliance with their system so that they can achieve their population reduction and control objectives. With money creation now rising vertically to feed the beast and stop the system locking up, we may be only months away from this happening, and it should be kept in mind that this is not accidental – it is all happening by design.
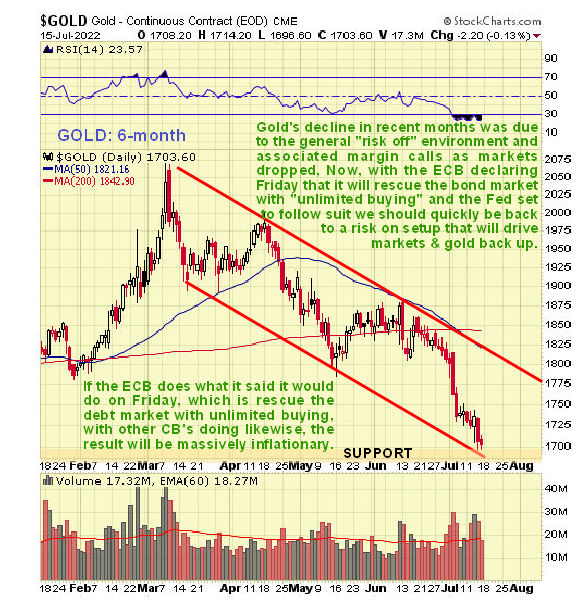
Given how inflation has been ballooning in the recent past it is surprising how much gold has fallen in recent weeks as we can see on its latest 6-month chart, but this has been largely due to the prevailing risk-off environment and associated margin calls. However, the ECBs Friday announcement should result in a swift reversal in sentiment leading to a rally, and as we can see on the chart, it is well placed to rally, having arrived at the lower boundary of its intermediate downtrend channel in an oversold state.
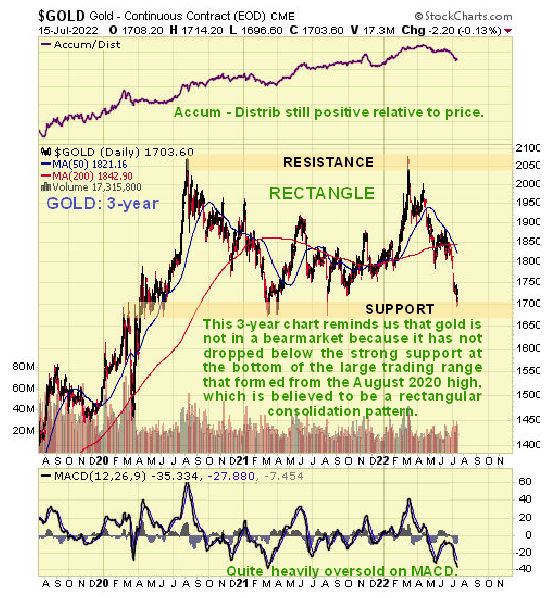
Gold’s 3-year chart makes two important points clear. One is that, because gold’s recent downtrend has brought it down to strong support approaching the lower boundary of the large rectangular trading range that has formed since the August 2020 peak, there is a higher likelihood of it reversing to the upside here. The other is that, because it has not broken down from this trading range, it is not in a bearmarket, and if we move towards hyperinflation this large range could turn out to be a consolidation pattern in an ongoing bullmarket. Additionally we can see that it is heavily oversold on its MACD indicator, so this is a good point for it to turn higher.
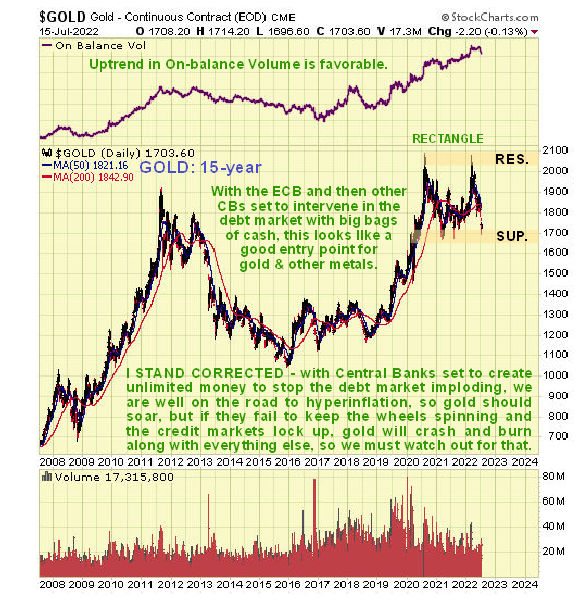
On gold’s long-term 15-year chart we can see that the rectangular trading range that has formed from mid-2020 could be either a consolidation pattern or a top. What happened in Friday’s promises a rally from the support at the lower boundary of the range at least to the top of it. However, the support at the bottom of this range must hold, if it later fails as a result of a general market crash occasioned by a severe credit crisis, then gold would probably plunge along with everything else, however the risk of this has been reduced for now by imminent renewed Central Bank intervention. If the Cetral Banks now pump in the ditection of hyperinflation then gold should fly off the to´p of this chart.
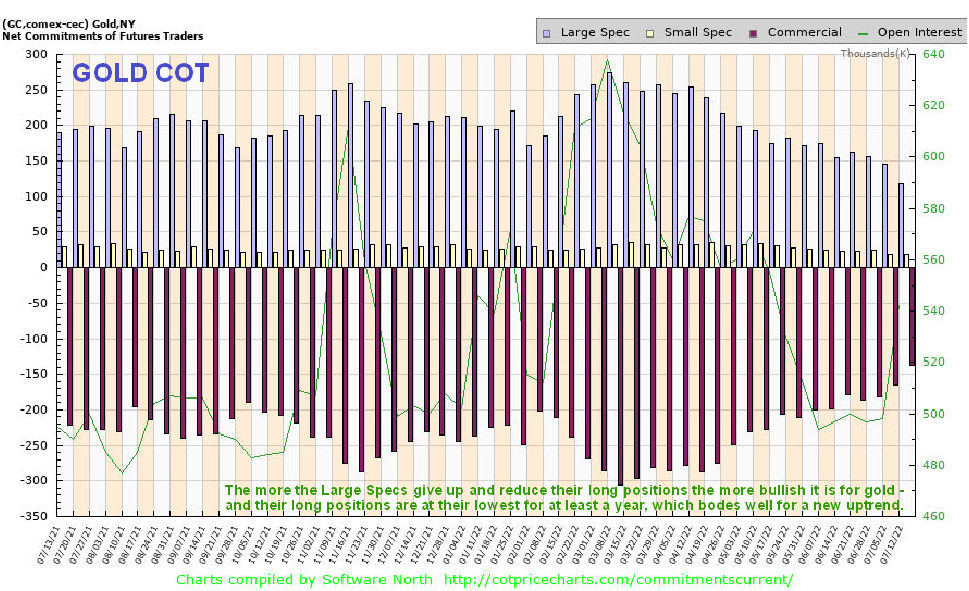
Gold’s latest COT chart is most encouraging as it shows that the normally wrong large Specs have reduced their long positions to the lowest levels for at least a year, which makes a reversal into an uptrend all the more likely, and here we should note that have not been net short gold for many years…
Click on chart to popup larger, clearer version.
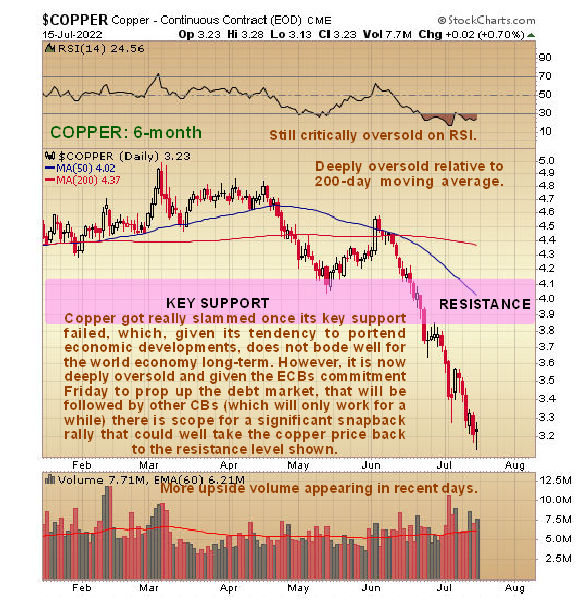
It is worth us taking a sideways look at copper here, because copper is often an advance indicator for the economy, hence its nickname Dr Copper, and these days it is something of a barometer for the Chinese economy because China uses so much of it. As we can see on its latest 6-month chart, copper has really been “taken to the woodshed” in recent weeks, suffering a nasty drop after failure of a key support level. This implies economic contraction ahead. However, it has dropped so far so fast that it is now extremely oversold – it is at its 3rd most oversold point in the past 20 years – on a sharp plunge late in 2011 it got a little more oversold and it got considerably more oversold on just one occasion, at the end of a severe plunge late in 2008 induced by the general market crash at that time. It is critically oversold on its RSI indicator and deeply oversold relative to its 200-day moving average so taking all these factors into account it is certainly entitled to a bounce.
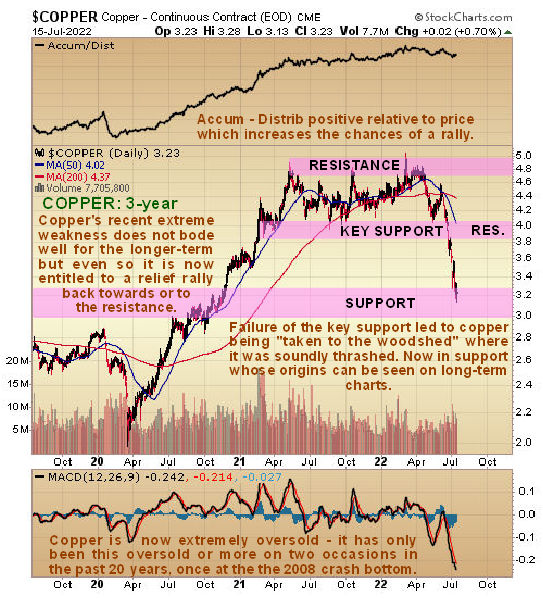
On copper’s 3-year chart we can see the reason technically that copper has dropped so steeply in recent months – it broke down from the large trading range that it had been stuck in for about a year from mid-2021, and of course the support at the lower boundary of this range is now a resistance level. Its hugely oversold condition coupled with the fact that it is now in a zone of quite strong support arising from trading late in 2018 and early in 2019 together with the probable shift back to risk on conditions makes a snapback recovery rally likely which would probably take it back up to resistance at the underside of the trading range.
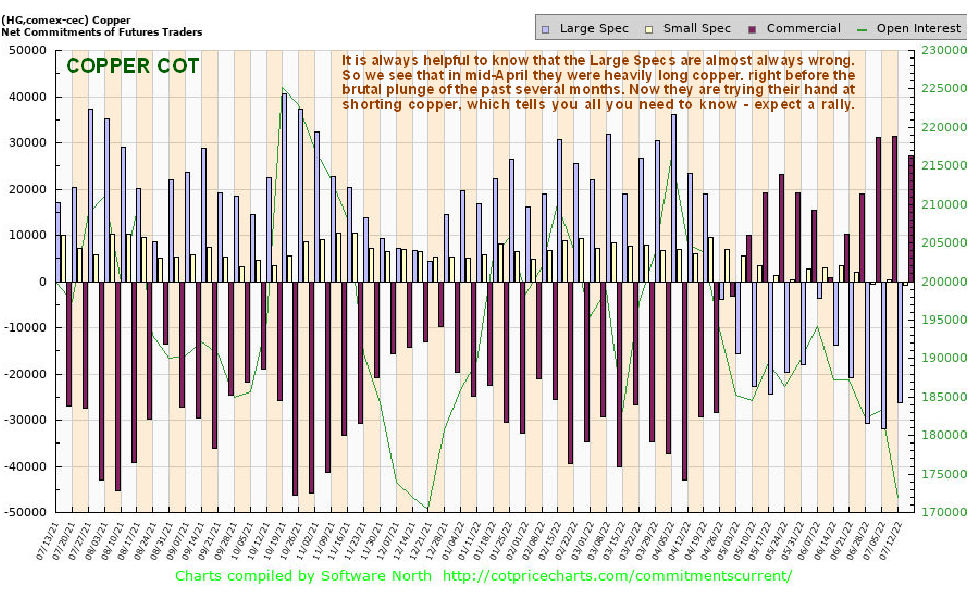
Another important factor that increases the chances of a recovery rally in copper is the fact that the normally wrong Large Specs, having gotten it spectacularly wrong being long copper back in the Spring, have now switched to being heavily short, suggesting a rally soon, as can be seen on the latest COT chart for copper. This of course begs the question “If the Large Specs keep losing money, how do they keep going?” – the answer is that they don’t, but as they fall they are replaced by more like them, kind of like British soldiers marching in lines towards machine guns at the Battle of the Somme.
Click on chart to popup larger, clearer version.
The risk off environment that has triggered big declines in metals prices in recent months has also contributed to a flight to safety into the dollar along with Emerging Markets struggling to service their dollar debts. So now we will take a quick look at the latest charts for the dollar index.
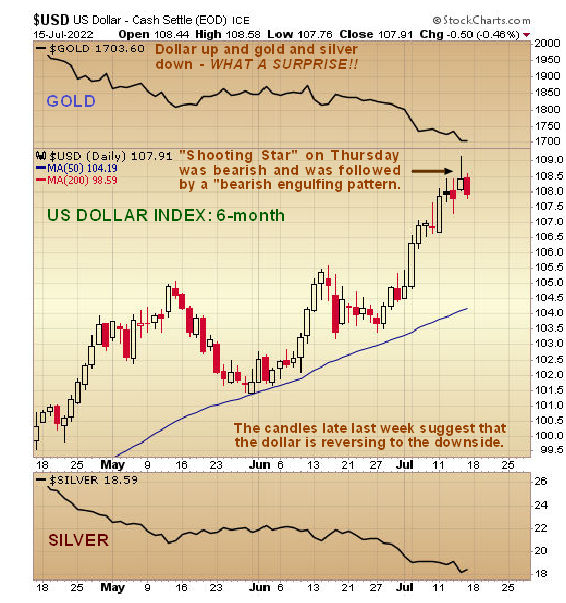
On the 6-month chart for the dollar index we can see that the further falls in gold and silver this month were partly or wholly due to strong gains in the index this month. However, we can also see that a bearish “shooting star” candle formed in the dollar index Thursday, suggesting an imminent reversal which was followed the next day – Friday – by another bearish candle that completed a “bearish engulfing pattern” about the time of the ECB announcement. The candles in the dollar index late last week suggest that it is reversing into a decline.
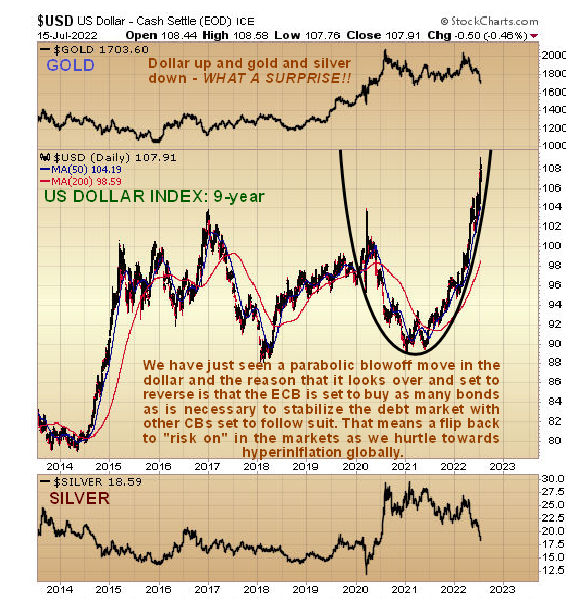
Thus it is most interesting to observe on the long-term 9-year chart for the dollar index that it has been accelerating higher in a parabolic slingshot move which, since it has gone vertical, suggests it is making a blowoff top right now. If it breaks down from this parabolic uptrend shortly it could drop hard – hardly surprising considering how much money the Fed is likely to create to save the debt market - and clearly, if it does, it will be very good news indeed for Precious Metals prices and base metal prices as well.
********

Clive P. Maund’s interest in markets started when, as an aimless youth searching for direction in his mid-20’s, he inherited some money. Unfortunately it was not enough to live a utopian lifestyle as a playboy or retire very young. Therefore on the advice of his brother, he bought a load of British Petroleum stock, which promptly went up 20% in the space of a few weeks. Clive sold them at the top…which really fired his imagination. The prospect of being able to buy securities and sell them later at a higher price, and make money for doing little or no work was most attractive – and so the quest began, especially as he had been further stoked up by watching from the sidelines with a mixture of fascination and envy as fortunes were made in the roaring gold and silver bull market of the late 70’s.
Clive furthered his education in Technical Analysis or charting by ordering various good books from the US and by applying what he learned at work on an everyday basis. He also obtained the UK Society of Technical Analysts’ Diploma.
The years following 2005 saw the boom phase of the Gold and Silver bull market, until they peaked in late 2011. While there is ongoing debate about whether that was the final high, it is not believed to be because of the continuing global debasement of fiat currency. The bear market since 2011 is viewed as being very similar to the 2-year reaction in the mid-70’s, which was preceded by a powerful advance and was followed by a gigantic parabolic price ramp. Moreover, Precious Metals should come back into their own when the various asset bubbles elsewhere burst, which looks set to happen anytime soon.
Visit Clive at his website: CliveMaund.com


