Gold, Miners And US Dollar - Various Correlations


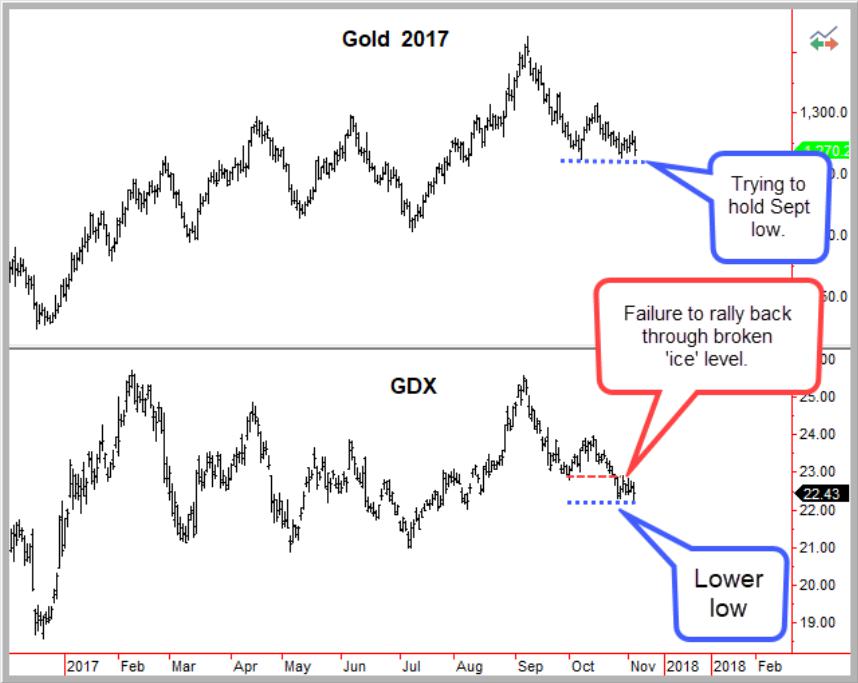
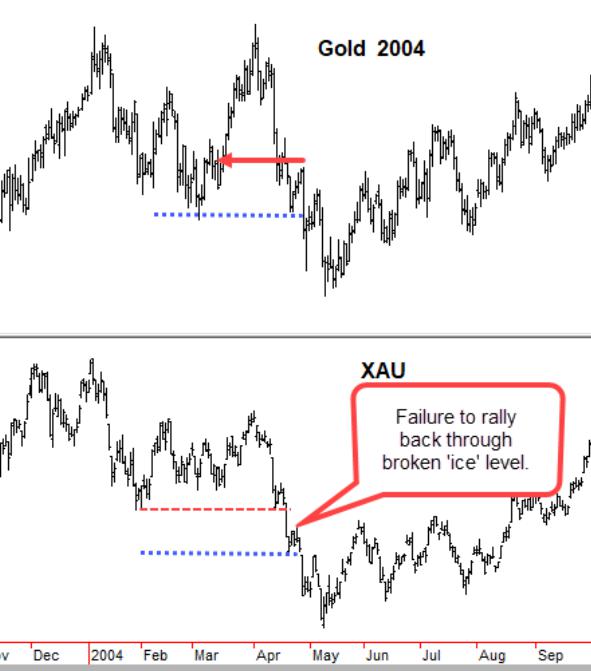
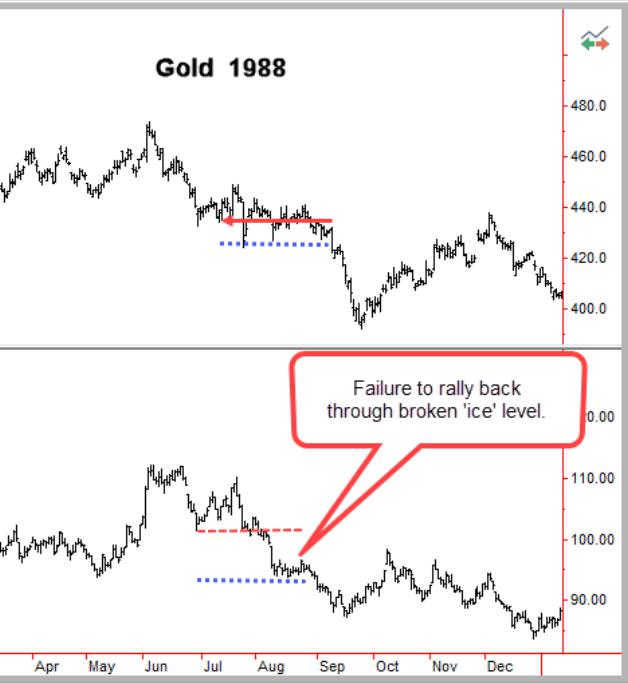
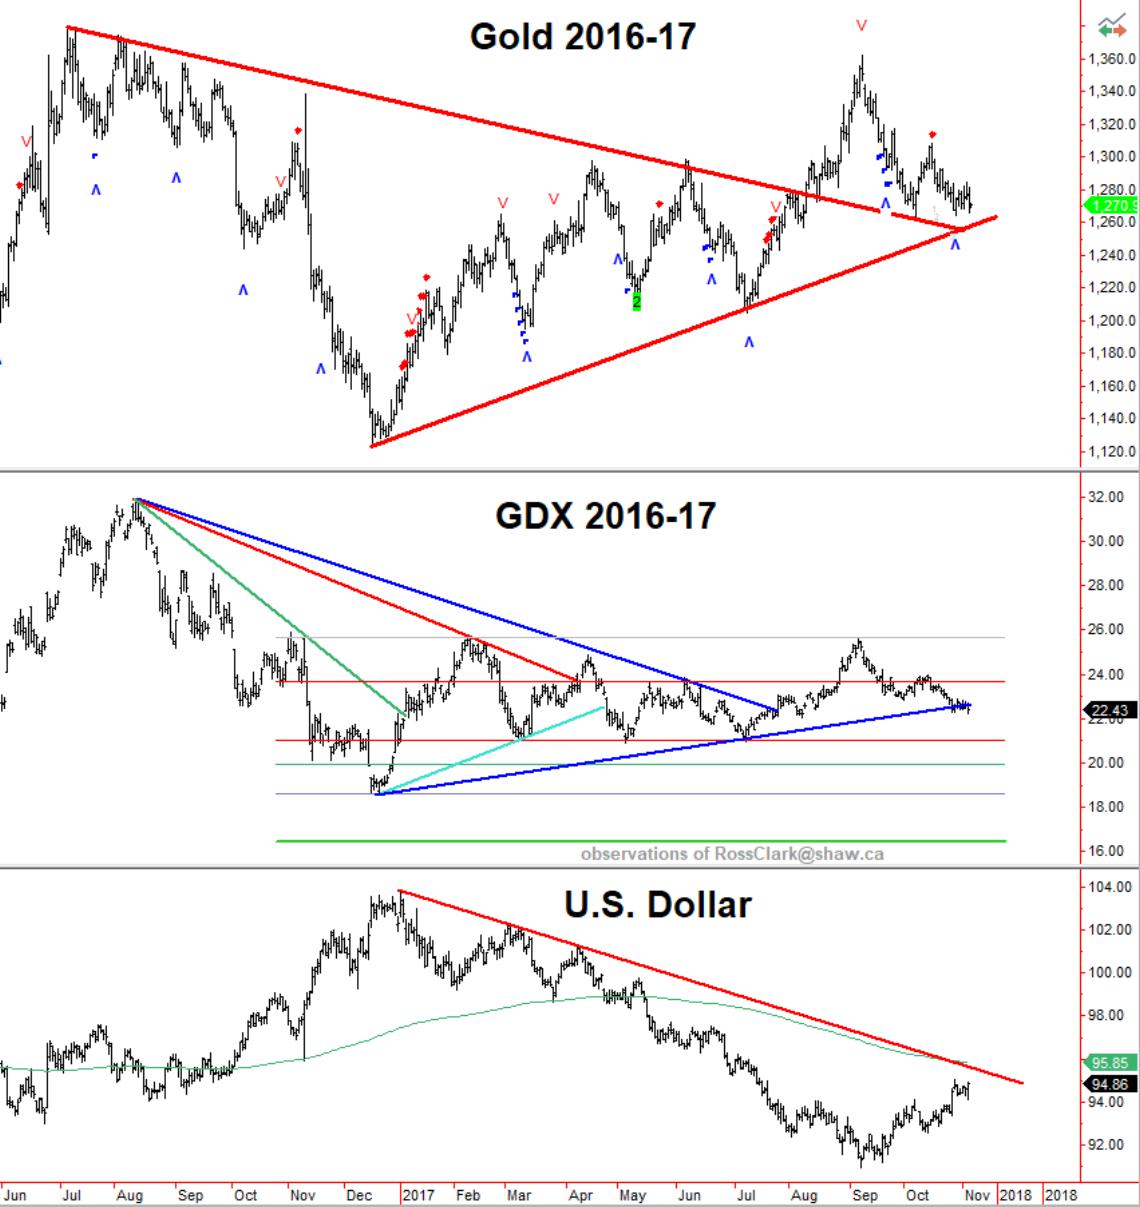
Gold and silver mining stocks have been underperforming bullion for several months. The oversold readings on October 26th/27th provided the opportunity for a change. However, while bullion managed to rally from a test of the September lows, the miners could not even get back to their September lows. Such weakness has previously foreshadowed another decline in prices (see 2004 and 1998 examples). However, this may be all part of a larger basing pattern similar to the 1986 bottom (see explanation below).
Poor Rally In Miners, Especially When Related To Bullion
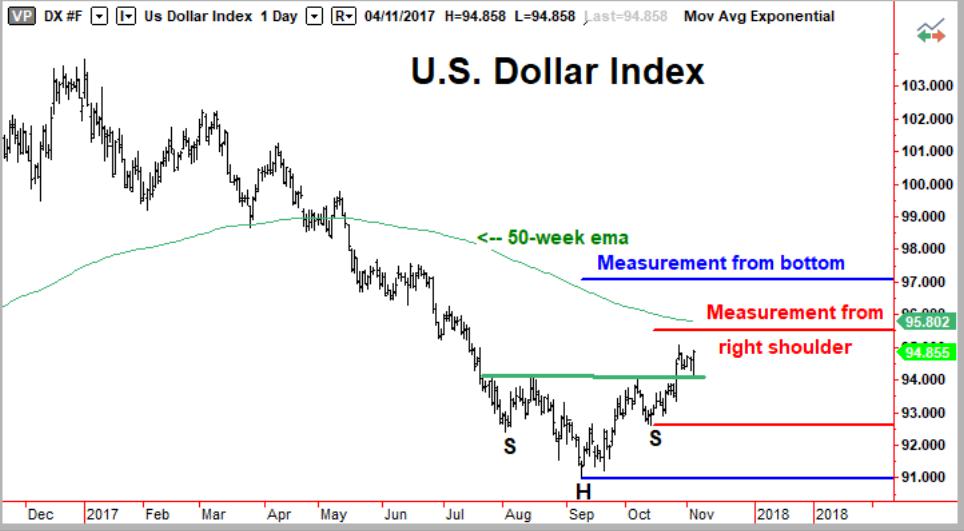
The weakness in metals fits with the underlying bottoming in the US Dollar Index. The Sequential 9 Sell Setup in the DX on October 26th coincided with the Buy Setup in gold. These are generally good for one to four-day corrections against the underlying trend, with the opportunity to develop into a more pronounce reversal. In this case the setups merely produced a pause in the trends.
The Dollar has now completed the well-structured Head and Shoulders base with a successful test of the neckline at Friday’s low. We continue to look for a rally to the 50-week ema (95.93) and possibly around the 97 measurements from the basing pattern.
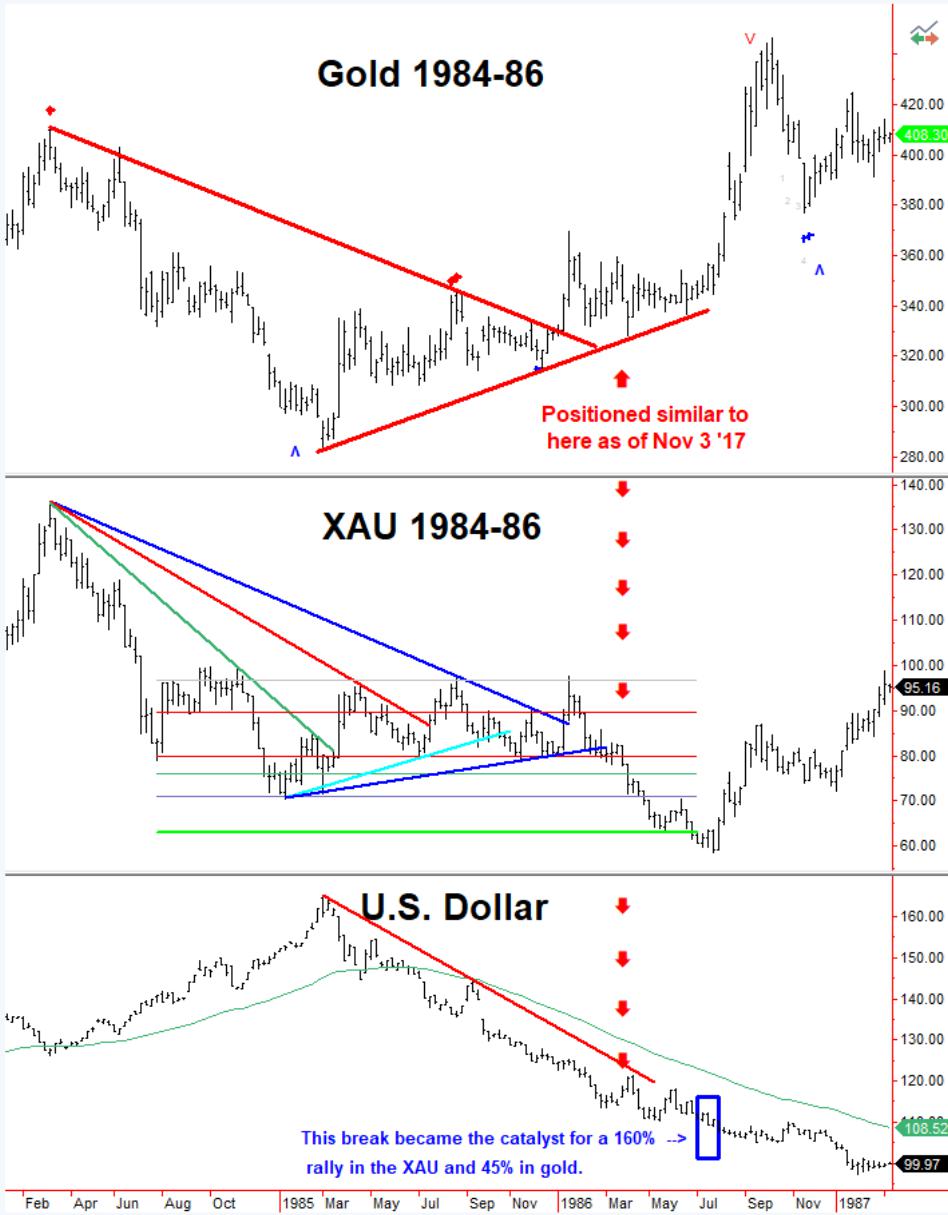
Our pattern recognition analysis pits the 1986 gold, XAU and US Dollar Index against the current time frame. Prices are currently lined up with March of 1986.
Having been in a bear market since February 1985, the DX made two attempted rallies; one into April ’86 and another six weeks later. Gold held well through the two rallies in the DX, merely testing support within its triangle pattern, but the miners broke support. By the time that the Dollar started to move into new lows in July the miners were down by a 25% from April.
The eventual catalyst for the rally out of the July 1986 bottom was a breakdown in the U.S. Dollar ( ).
By the summer of 1987 the DX dropped an additional 20%. The XAU rallied by 160% and gold by 46%.
For now, the miners have been weak as the Dollar as rallied from the September low. Let’s see how they react to action in the US Dollar once it achieves some of the upside targets.
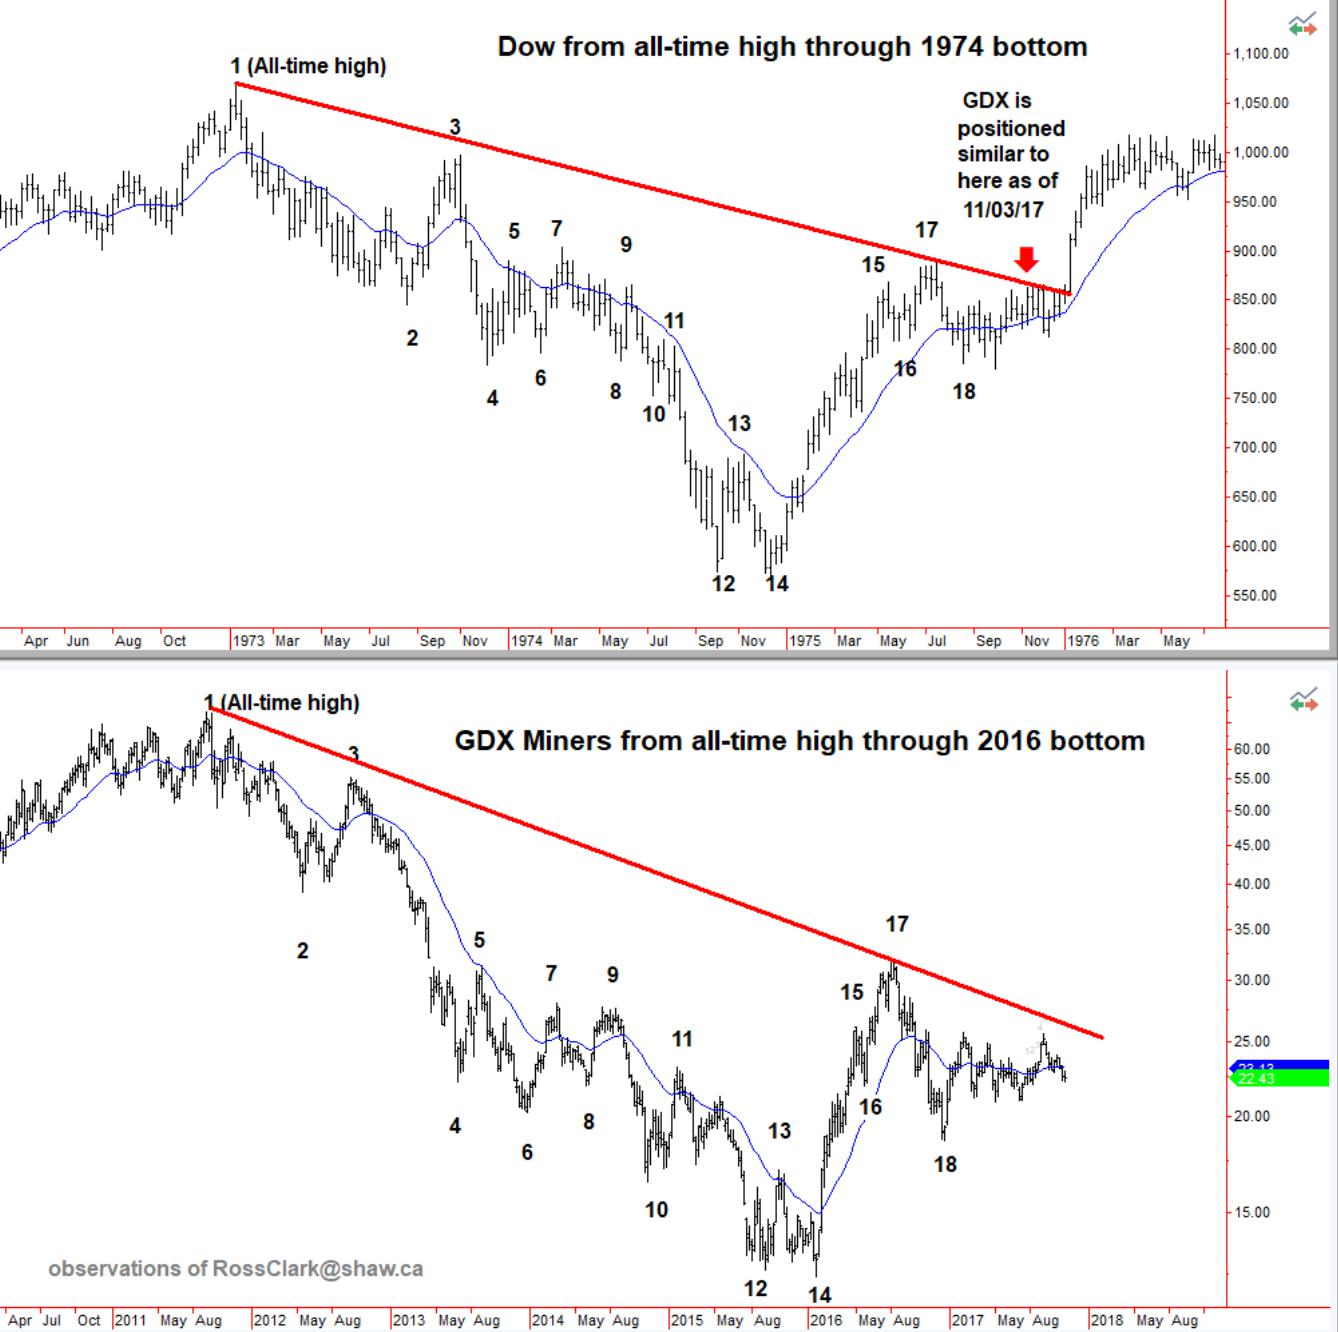
Our second pattern recognition analysis maps the current development in gold miners with the bear market in equities from 1973 through 1974 and the subsequent initial stages of the bull market. A close above $25 in the GDX in the coming months would be viewed as a very bullish development.
Opinions in this report are solely those of the author. The information herein was obtained from various sources; however, we do not guarantee its accuracy or completeness. This research report is prepared for general circulation and is circulated for general information only. It does not have regard to the specific investment objectives, financial situation, and the needs regarding the appropriateness of investing in any securities or investment strategies discussed or recommended in this report and should understand that statements regarding future prospects may not be realized.
Investors should note that income from such securities, if any, may fluctuate and that each security’s price or value may rise or fall. Accordingly, investors may receive back less than originally invested. Past performance is not necessarily a guide to future performance. Neither the information nor any opinion expressed constitutes an offer to buy or sell any securities or options or futures contracts. Foreign currency rates of exchange may adversely affect the value, price or income of any security or related investment mentioned in this report. In addition, investors in securities such as ADRs, whose values are influenced by the currency of the underlying security, effectively assume currency risk. Moreover, from time to time, members of the Institutional Advisors team may be long or short positions discussed in our publications.
BOB HOYE, INSTITUTIONAL ADVISORS
EMAIL [email protected]
WEBSITE www.institutionaladvisors.com
 Bob Hoye is the chief financial strategist of Institutional Advisers.


