Gold Miners: Will Investors Dump the Laggards?


Mining stocks were picked up by investors in the latest bullish wave. But these bad performers may be dumped just as quickly as they were bought.
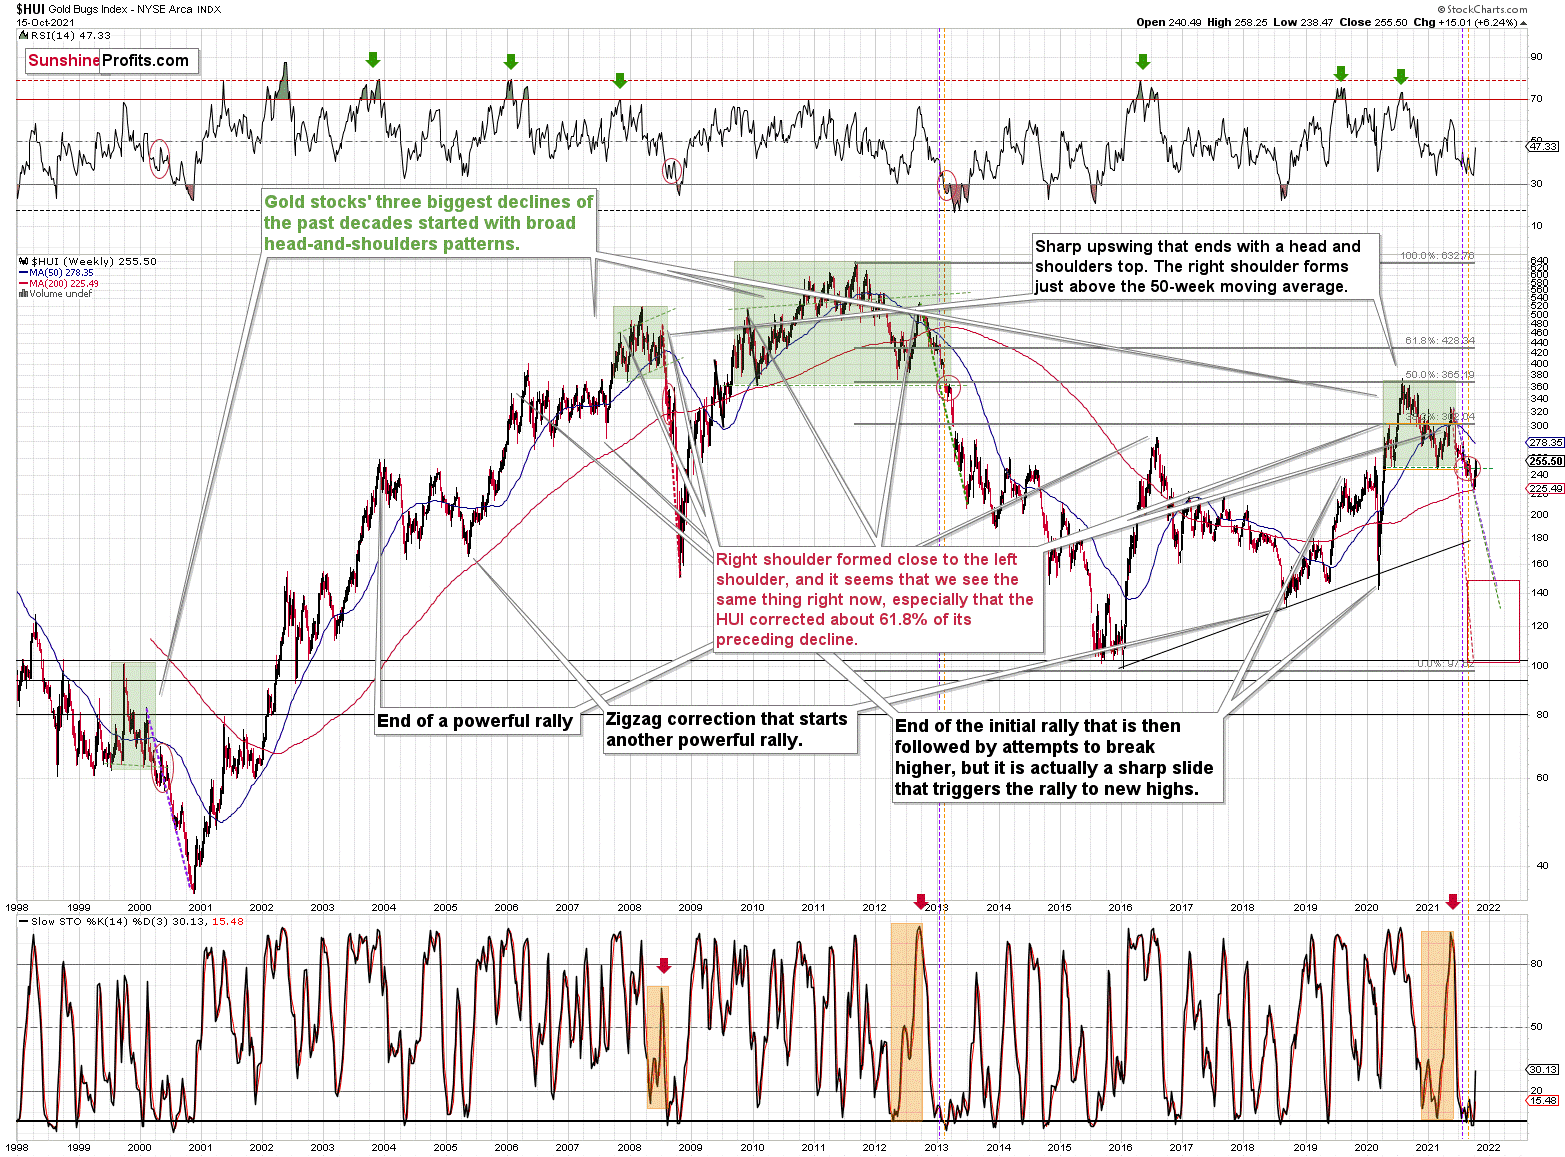
After the HUI Index rallied back above the neckline of its bearish head & shoulders pattern, a new bull market for mining stocks has finally begun. Or has it? Well, after an identical development occurred in 2000, the HUI Index soon invalidated the breakout (and once again confirmed the breakdown) and a sharp decline followed.
Please see below:
As further evidence, stock market strength often follows the aphorism that ‘a rising tide lifts all boats.’
And while gold mining stocks rode the bullish wave, the sentiment high will likely reverse over the medium term.
To explain, silver and mining stocks are some of the worst performers when volatility strikes the general stock market. And with mining stocks’ recent bout of optimism underwritten by the ‘everything rally’ that we witnessed last week, when market participants ‘panic buy’ everything in sight, they often gobble up the major laggards (with the goal of capitalizing on potential mean reversion). Moreover, with silver and mining stocks some of the worst-performing assets YTD, the excessive optimism helped uplift these laggards last week.
To that point, with last week’s move largely driven by sentiment and not fundamental or technical realities, silver and mining stocks’ rallies are unlikely to hold over the medium term. Furthermore, it’s important to remember that cheap assets are often cheap for a reason. And with the marginal buyer of silver and mining stocks buying momentum and not fundamentals, they’ll likely end up holding the bag if/when sentiment reverses once again.
In other words, it was probably buying from the general public that helped to lift gold stocks higher – the kind of investors that enter the market at the end of the upswing, buying what’s cheap regardless of the outlook. And these are also the kind of investors that tend to lose money.
If you really think that gold stocks were strong last week, please compare their performance to the one of copper, for example. The latter moved sharply higher, while miners simply corrected from their yearly lows.
In addition, while I’ve also been warning about the ominous similarity to 2012-2013, the HUI Index continues to hop into the time machine. To explain, the vertical, dashed lines above demonstrate how the HUI Index is following its 2012-2013 playbook. For example, after a slight buy signal from the stochastic indicator in 2012, the short-term pause was followed by another sharp drawdown. For context, after the HUI Index recorded a short-term buy signal in late 2012 – when the index’s stochastic indicator was already below the 20 level (around 10) and the index was in the process of forming the right shoulder of a huge, medium-term head-and-shoulders pattern – the index moved slightly higher, consolidated, and then fell off a cliff. Thus, the HUI Index is quite likely to decline to its 200-week moving average (or so) before pausing and recording a corrective upswing. That’s close to the 220 level. Thereafter, the index will likely continue its bearish journey and record a final medium-term low some time in December.
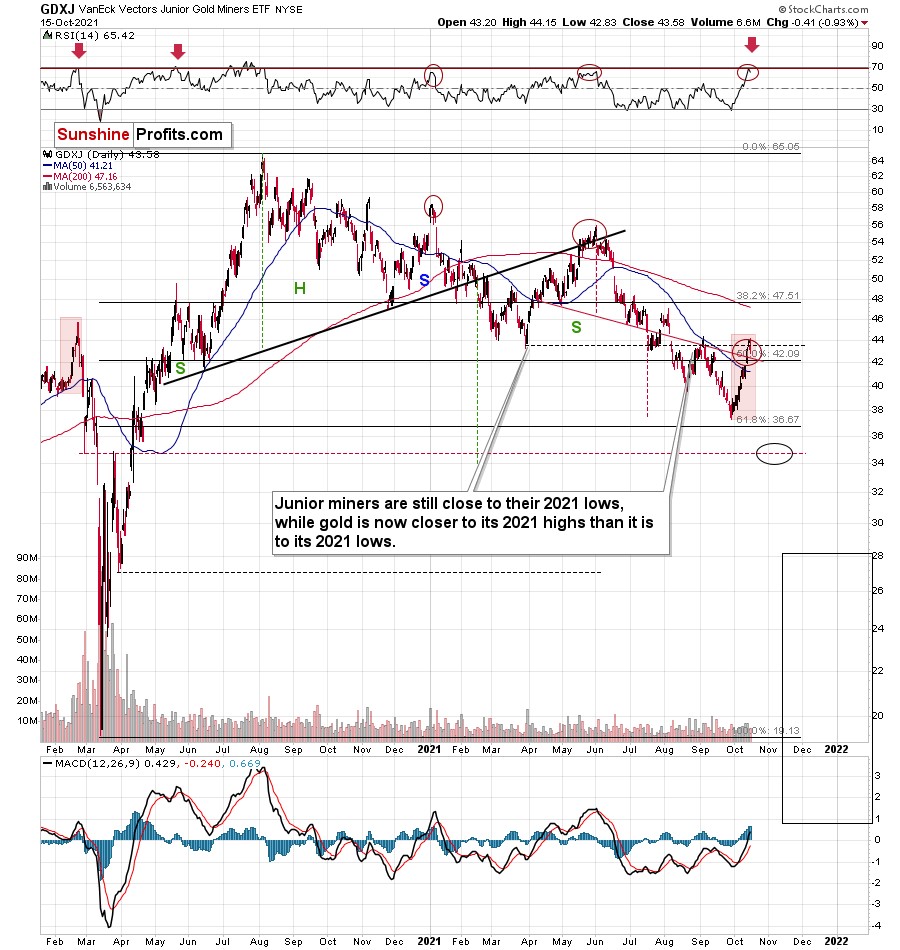
Furthermore, I warned previously that the miners’ drastic underperformance of gold was an extremely bearish sign. There were several weeks when gold rallied visibly, and the HUI Index actually declined modestly. And now, gold stocks are trading close to their previous 2021 lows, while gold is almost right in the middle between its yearly high and its yearly low.
And why is this so important? Well, because the bearish implications of gold stocks’ extreme underperformance still remain intact.
Let’s keep in mind that the drastic underperformance of the HUI Index also preceded the bloodbath in 2008 as well as in 2012 and 2013. To explain, right before the huge slide in late September and early October 2008, gold was still moving to new intraday highs; the HUI Index was ignoring that, and then it declined despite gold’s rally. However, it was also the case that the general stock market suffered materially. If stocks didn’t decline so profoundly back then, gold stocks’ underperformance relative to gold would have likely been present but more moderate.
Nonetheless, broad head & shoulders patterns have often been precursors to monumental collapses. For example, when the HUI Index retraced a bit more than 61.8% of its downswing in 2008 and in between 50% and 61.8% of its downswing in 2012 before eventually rolling over, in both (2008 and 2012) cases, the final top – the right shoulder – formed close to the price where the left shoulder topped. And in early 2020, the left shoulder topped at 303.02. Thus, three of the biggest declines in the gold mining stocks (I’m using the HUI Index as a proxy here) all started with broad, multi-month head-and-shoulders patterns. And in all three cases, the size of the declines exceeded the size of the head of the pattern. As a reminder, the HUI Index recently completed the same formation.
Yes, the HUI Index moved back below the previous lows and the neck level of the formation, which – at face value – means that the formation was invalidated, but we saw a similar “invalidation” in 2000 and in 2013. Afterwards, the decline followed anyway. Consequently, I don’t think that taking the recent move higher at its face value is appropriate. It seems to me that the analogies to the very similar situation from the past are more important.
As a result, we’re confronted with two bearish scenarios:
- If things develop as they did in 2000 and 2012-2013, gold stocks are likely to bottom close to their early-2020 low.
- If things develop like in 2008 (which might be the case, given the extremely high participation of the investment public in the stock market and other markets), gold stocks could re-test (or break slightly below) their 2016 low.
In both cases, the forecast for silver, gold, and mining stocks is extremely bearish for the next several months.
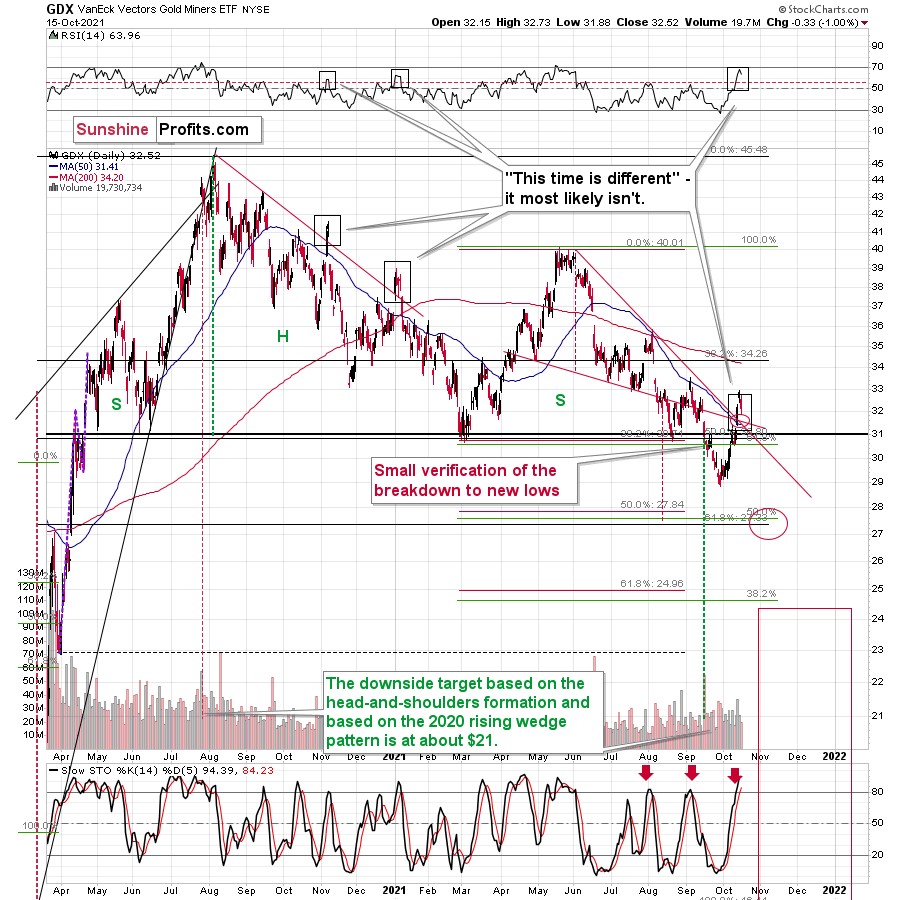
For even more confirmation, let’s compare the behavior of the GDX ETF and the GDXJ ETF. Regarding the former, the GDX ETF’s small breakout mirrors what we witnessed during the senior miners’ downtrend in late 2020/early 2021. Moreover, when the GDX ETF’s RSI (Relative Strength Index) approached 70 (overbought conditions) back then, the highs were in (or near) and sharp reversals followed.
Please see below:
As for the GDXJ ETF, the gold junior miners’ RSI also signals overbought conditions and history has been unkind when similar developments have occurred.
To explain, I wrote on Oct. 15:
It is quite interesting when you consider how high the RSI is right now, and when in the past both the RSI and the GDXJ itself were trading at today’s levels.
That was in late February 2020. Back then, juniors were after a short-term rally from below $40, and they topped above $44. The RSI approached 70 — just like what we see today. And then the GDXJ declined below $20 in less than a month. I think the decline will take place longer this time, but the outlook is still extremely bearish.
By the way, the last time when the RSI was as high as it is right now was… right at the 2020 top. That’s yet another indication for gold that signals that the top is in or at hand.
Please see below:
Also noteworthy, while mining stocks outperformed gold on Oct. 15, their relative strength requires further verification to be considered material. For example, gold declined by 1.65% on Oct. 15, while the GDX ETF and the GDXJ ETF were down by roughly 1%. Moreover, this occurred with the USD Index largely flat. However, mining stocks will likely play catch-up over the next few months and their relative strength should reverse over the medium term.
In other words, it’s not correct to simply compare gold stocks and gold right now and say that the former were strong. It should be noted that the USD Index did nothing on Friday (Oct. 15) and gold stocks declined anyway. Consequently, it’s just the case that gold was the “odd man out” on Friday, while other markets were relatively normal. The USD Index verified its breakout, but it hasn’t moved visibly higher yet, so miners didn’t move visibly lower yet. Yet.
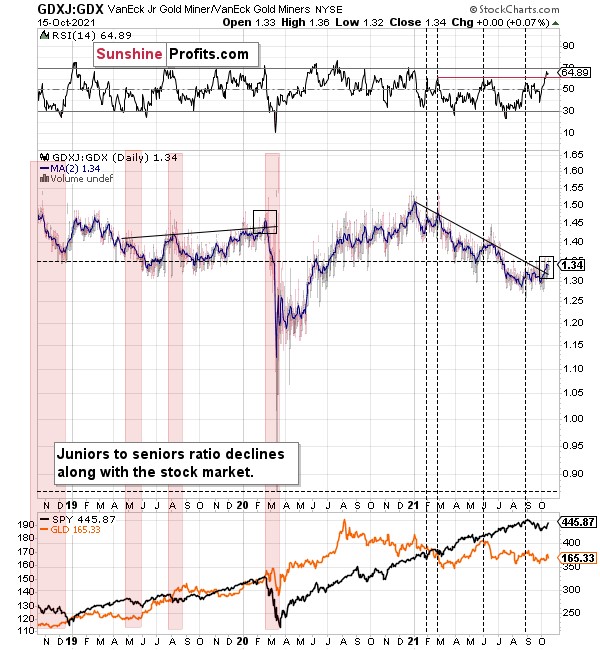
Finally, while I’ve been warning for months that the GDXJ/GDX ratio was destined for devaluation, the ratio has fallen precipitously in 2021. And while a tiny breakout occurred last week, the price action actually mirrors what we witnessed in early 2020 – right before the ratio fell off a cliff. As a result, further downside likely lies ahead.
The bottom line?
If the ratio is likely to continue its decline, then on a short-term basis we can expect it to decline to 1.27 or so. If the general stock market plunges, the ratio could move even lower, but let’s assume that stocks decline moderately (just as they did in the last couple of days) or that they do nothing or rally slightly. They’ve done all the above recently, so it’s natural to expect that this will be the case. Consequently, the trend in the GDXJ to GDX ratio would also be likely to continue, and thus expecting a move to about 1.26 - 1.27 seems rational.
If the GDX is about to decline to approximately $28 before correcting, then we might expect the GDXJ to decline to about $28 x 1.27 = $35.56 or $28 x 1.26 = $35.28. In other words, ~$28 in the GDX is likely to correspond to about $35 in the GDXJ.
Is there any technical support around $35 that would be likely to stop the decline? Yes. It’s provided by the late-Feb. 2020 low ($34.70) and the late-March high ($34.84). There’s also the late-April low at $35.63.
Consequently, it seems that expecting the GDXJ to decline to about $35 is justified from the technical point of view as well.
In conclusion, gold, silver, and mining stocks are doing what they often do: with short-term oversold conditions eliciting countertrend rallies, investors that ignore history, technicals, and fundamentals are hoping that this is the rally where the precious metals finally deliver on all of their promises. However, with each corrective upswing akin to ‘The Boy Who Cried Wolf,’ investors are often left disappointed when they run to the precious metals rescue. As a result, a similar outcome will likely materialize this time around.
Thank you for reading our free analysis today. Please note that the above is just a small fraction of today’s all-encompassing Gold & Silver Trading Alert. The latter includes multiple premium details such as the targets for gold and mining stocks that could be reached in the next few weeks. If you’d like to read those premium details, we have good news for you. As soon as you sign up for our free gold newsletter, you’ll get a free 7-day no-obligation trial access to our premium Gold & Silver Trading Alerts. It’s really free – sign up today.
Przemyslaw Radomski, CFA
Founder, Editor-in-chief
Sunshine Profits: Effective Investment through Diligence & Care
* * * * *
All essays, research and information found above represent analyses and opinions of Przemyslaw Radomski, CFA and Sunshine Profits' associates only. As such, it may prove wrong and be subject to change without notice. Opinions and analyses are based on data available to authors of respective essays at the time of writing. Although the information provided above is based on careful research and sources that are deemed to be accurate, Przemyslaw Radomski, CFA and his associates do not guarantee the accuracy or thoroughness of the data or information reported. The opinions published above are neither an offer nor a recommendation to purchase or sell any securities. Mr. Radomski is not a Registered Securities Advisor. By reading Przemyslaw Radomski's, CFA reports you fully agree that he will not be held responsible or liable for any decisions you make regarding any information provided in these reports. Investing, trading and speculation in any financial markets may involve high risk of loss. Przemyslaw Radomski, CFA, Sunshine Profits' employees and affiliates as well as members of their families may have a short or long position in any securities, including those mentioned in any of the reports or essays, and may make additional purchases and/or sales of those securities without notice.
********
 Przemyslaw Radomski, CFA, is the founder, owner and the main editor of SunshineProfits.com. You can reach Przemyslaw at: http://www.sunshineprofits.com/help/contact-us/.


