Gold: Near-Term-Churn Remains The Watchword


Greetings this time 'round from Squaw Valley, where -- as has Gold piled onto price throughout these past seven weeks -- the snow depth for skiing still is piled seven feet high at the 8,200-foot (2,500-metre) level. Skiing in July? Get it while you can ... as is perfectly akin to Gold!
Not to damper our "endless winter" enthusiasm, but per the key point from a week ago: we're not anticipating any imminent Gold milestones from here. Price settled out the week yesterday (Friday) at 1401 after having in the prior two weeks (as you well know, lest you live in a hole) surpassed Base Camp 1377 and our "conservative" forecast high for this year of 1434. For as summer's sun churns winter's snow to water, likewise do we sense the trading process to churn Gold's superb upside progress to oscillation, ideally with support no lower than 1377, yet with resistance so as not to move materially above 1434, let alone last week's "overshoot" high of 1442.
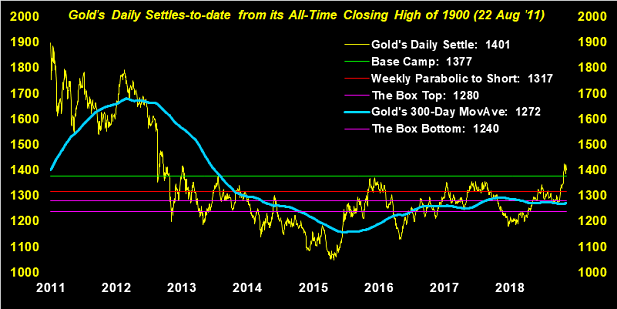
Indeed, our recent missives have cited how rare 'tis been for Gold to be trading in the 1400s period. To further update that data, since Gold's All-Time Closing High of 1900 on 22 August 2011, there've now passed 1,980 trading days, in which for only 37 of them price has settled in the 1400s : that's just 1.9% of the time. One might thus opine that Gold having not essentially endured this area before, nobody really knows what to do.
'Course, you not being nobody know better, per our summarized view from a week ago to "...Enjoy the moment, weather the near-term pullbacks, and we'll see what lies further up Gold's road before this year is out..." And speaking of better as we turn to the weekly bars with price from low-to-high these past seven weeks +8.9%, a better upside breakout has only been recorded once by Gold (since its All-Time High back in 2011) given a seven-week period: the one that ended 11 March 2016 (+9.7%). So this is the real deal, baby:

More broadly, even Gold's 300-day moving average is again kinking higher. For you pre-2011 Gold aficionados, well-remembered is said average's proven price support for the years 2001 right into 2011, (at which time you may recall our writing of Gold's "...getting ahead of itself..."). But should this 300-day moving average regain such stalwart support status, 'twill indeed be the "real deal" personified:
As for the stumblin' Economic Barometer, 'tis in full-fumblin', Gold-positive force. Frankly, we are perennially amazed that it takes the global financial world -- from the Federal Open Market Committee to the trading desks of the most recognized investment banks -- some nine months to a year to catch onto this. In fact so much so do we find the world's monetary movers behind the curve that (again) never have we seen this much graphical divergence between the "Hell-bent for 3000" S&P 500 and the declining Econ Baro. With a colleague across the pond this past week in rationalizing the madness (oxymoron), we texted "...Rates remain relatively low, stocks are the place to be, herd mentality over responsibility, finmedia hype, no concept of the « savings account », prices always recover from corrections, earnings (or the lack thereof) are disregarded ... the list is limitless. (Eventually regression to the mean ensues, oft with panicky fear)..."
Specific to incoming metrics from last week, save for June's payrolls improvement, the month recorded an increase in the Unemployment Rate, slowing growth in Hourly Earnings, and slowdowns as well in the Institute for Supply Management's Manufacturing and Services Indices. Moreover for May, Construction Spending turned negative as did Factory Orders, plus the Trade Deficit ballooned. Put it all together -- adding in the fact that the stock market doesn't give a derrière du rat -- and here are the Baro and S&P, (and as you also well know, the red line eventually works toward the level of the blue line):
Still through it all, the children at the once mighty Barron's spew out headlines such as "The Market Has Been on a Tear. It’s Time to Get Greedy." In the midst of which elsewhere, come November, Christine "pro-debt and spend" Lagarde likely takes over the Presidency in Brussels at the European Central Bank, just as German manufacturing orders and business optimism are now faltering ... and yet Deutsche Bank is to embark upon a wealth management hiring spree ... Whoopie! (Talk about signs of a market top!) Then StateSide, the Trumpster is looking to Judy "pro-Gold" Shelton and Chris "dovish" Waller as Fed nominees. Gold-positive indeed!
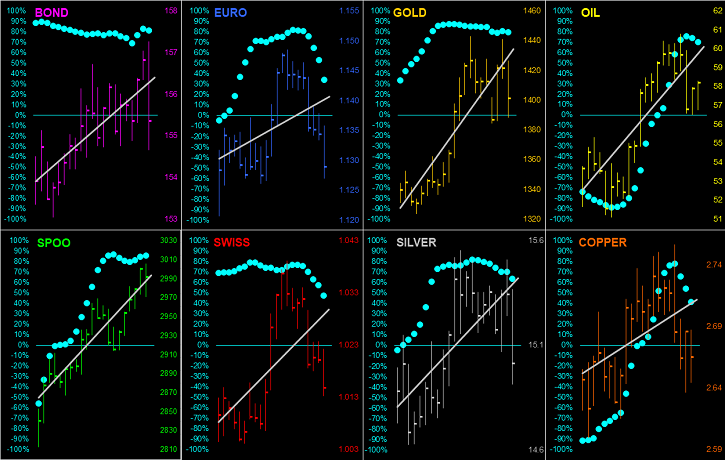
Speaking of positive ... but seemingly not for "long" (pun intended) ... are the 21-day linear regression trendlines for all eight BEGOS Markets components as we go 'round the horn with them here. Each panel comprises the past 21 trading days (one month), the diagonal trendline, and those tell-tale "Baby Blues" for which falling dots generally lead price to lower spots:
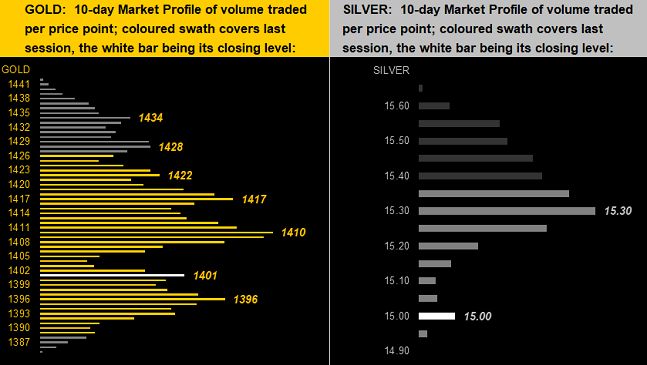
Meanwhile, drilling down into the past two weeks for the precious metals we find price in the lower reaches of the 10-day Market Profiles respectively for Gold below left and Silver below right. And as you no doubt saw in the aforeshown weekly bars graphic, the Gold/Silver ratio now stands at 93.3x: save for the brief blip to 99x back in '91 (and a couple of 97x readings during World War II) this is basically record-high ratio territory. "Sister Silver wants YOU!"
Given Gold's material upside progress of late, let's look at its stance in the stack:
The Gold Stack
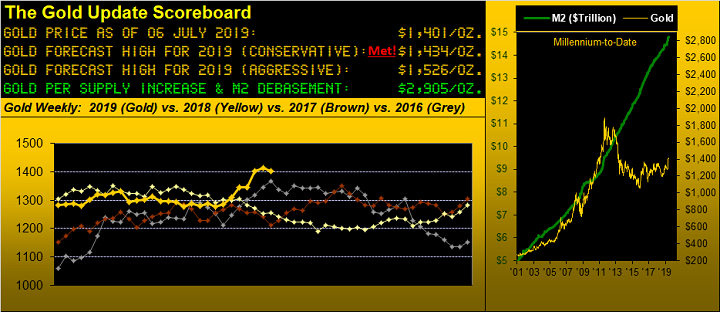
Gold's Value per Dollar Debasement, (from our opening "Scoreboard"): 2905
Gold’s All-Time High: 1923 (06 September 2011)
The Gateway to 2000: 1900+
Gold’s All-Time Closing High: 1900 (22 August 2011)
The Final Frontier: 1800-1900
The Northern Front: 1750-1800
On Maneuvers: 1579-1750
The Floor: 1466-1579
Le Sous-sol: Sub-1466
2019's High: 1443 (25 June)
10-Session “volume-weighted” average price magnet: 1412
Trading Resistance: 1410 / 1417 / 1422 / 1428 / 1434
Gold Currently: 1401, (expected daily trading range ["EDTR"]: 24 points)
Trading Support: 1401 / 1396
10-Session directional range: down to 1385 (from 1443) = -58 points or -4.0%
Base Camp: 1377
The 1360s Double-Top: (1362 in Sep '17 and 1369 in Apr '18)
The Weekly Parabolic Price to flip Short: 1317
Neverland: The Whiny 1290s
The Box: 1280-1240
The 300-Day Moving Average: 1272 and rising
2019's Low: 1267 (02 May)
Our wrap for this week? Gold's price is piled high, as is the snow for these fellow ski lift riders from the 4th of July! Bring on the Gold and the Silver Stars!

Mark Mead Baillie has had an extensive business career beginning in banking and financial services for two years with Banque Nationale de Paris to corporate research for three years at Barclays Bank and then for six years as an analyst and corporate lender with Société Générale.
For the last 22 years he has expanded his financial expertise by creating his own financial services company, de Meadville International, which comprehensively follows his BEGOS complex of markets (Bond/Euro/Gold/Oil/S&P) and the trading of the futures therein. He is recognized within the financial community of demonstrating creative technical skills that surpass industry standards toward making highly informed market assessments and his work is featured in Merrill Lynch Wealth Management client presentations. He has adapted such skills into becoming the popular author each week of the prolific “The Gold Update” and is known in the financial website community as “mmb” and “deMeadville”.
Mr. Baillie holds a BS in Business from the University of Southern California and an MBA in Finance from Golden Gate University.


