Gold: Our Near-Term Downside Target Zone


As herein penned just a week ago for Gold: “…the present … Long trend can swiftly end in tears. Either Gold right now resumes adroitly up, or … just a wee drop in actual price, and ’tis over. A new Short trend would then ensue, and … even the 1800s may return anew….”
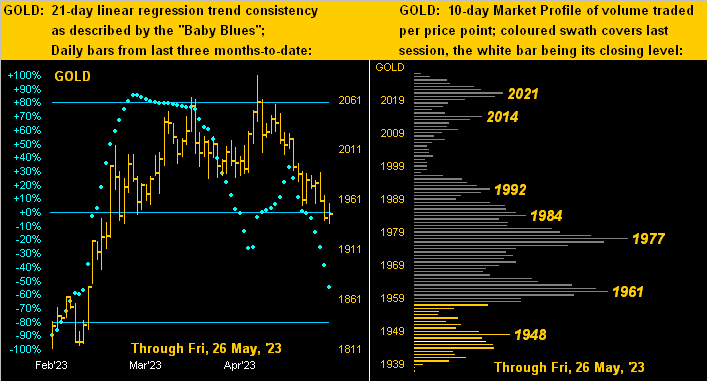
And so ’twas the latter case that came to pass this past Thursday (at precisely 12:42 GMT) upon Gold penetrating the 1942 level. And lo (double entendre), a fresh red encircled dot was printed, heralding the start of a new Short trend for Gold’s weekly bars:

And thus the age old question again is asked: “How low doth Gold go?” Within the above graphic, the white area represents the most recently carved support structure for Gold, spanning from the 02 February high of 1975 down to the 28 February low of 1810. Therein, the green zone encompasses Golden Ratio support spanning from 1912 to 1874. That in turn is bisected by the purple midpoint support line at 1893 — a reasonable downside target — which is -53 points below Gold’s having settled out the week yesterday (Friday) at 1946.
More specific to the last 10 parabolic Short trends that extend back a full five years, be it by average, trimmed-mean, or median adversity, such vacuum suggests Gold reaching the 1852-1835 area. Whilst that still is inside the overall white support structure, our lean is that the 1893 purple line is the extent of adversity on this down run. On verra…
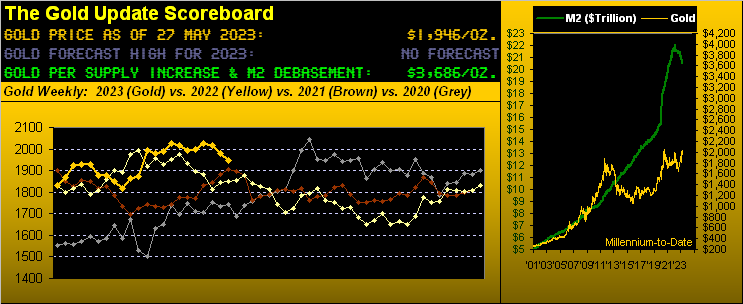
‘Course, that’s all technical. But as long as Gold continues to be kicked around as a commodity rather than as a currency, the technicals typically will out. Ultimately there remains the main fundamental: currency debasement. And by our opening Gold Scoreboard, we value Gold today at 3686, even accounting for the wee increase in the supply of Gold itself plus some shrinkage of late in the StateSide “M2” Money Supply.
“But mmb, Gold always rises to prior maximum debasement values, right?”
Exactly right there, Squire. Historically ’tis the case, however the lag time can be significant: the last such occurrence was per Gold’s still-standing All-Time High of 2089 on 07 August 2020, the debasement value for which was attained some eight years earlier during March 2012. Indeed as a charter reader of The Gold Update has quipped these many years: “Gold will make you old.” But ’twill also make you financially substantive.
Speaking of substantive, such is the state of the Federal Reserve’s favoured inflation rate. As the Fed assumes that neither do you drive nor eat, it looks to push down Core Personal Consumption Expenditures to an annualized inflation pace of +2%. And the full-throat FinMedia buzz is that following another +0.25% FedFunds rate increase come the 14 June Open Market Committee’s Policy Statement, they shall then “pause”. Shall that produce enough “economic slowdown” to garner just +2% annualized Core PCE inflation? We don’t think so, per the following graphic:
We constructed this inflation measure two ways from January 2020-to-date. First, the yellow line takes each month’s Core PCE rate and annualizes it (which for you West Palm Beachers down there is x 12). Second, the blue line is the moving 12 months’ summation of the Core PCE, which is the more commonly accepted version. The Fed’s horizontal red line goal is at 2%. Does the blue line look like it’s about to drop to the red line anytime soon? No it doesn’t. And there are five more FOMC meetings still in this year’s balance alone.
As for “economic slowdown”, by our tried-and-true Economic Barometer (now in its 26th calendar year), “slowdown” of late appears more as “boomtown”:
And as has been the rule rather than the exception through these last four weeks (basically a whole month’s worth of data) period-over-period metrics are improving. Of the 10 that hit the Baro this past week, 8 were better, including April’s Personal Income, Personal Spending, both New and Pending Home Sales, plus an upward revision to Q1’s Gross Domestic Product from +1.1% (annualized) to +1.3%. ‘Course, the cautionary note therein is inflation’s effect vs. REAL growth. And that shall keep the Fed’s foot on the rate raise throttle, even as the Minutes from the FOMC’s 02-03 May meeting noted some members’ thoughts to potentially “pause”. But the Econ Baro since then has been a rocket ship … albeit somewhat fueled “as things get worse more slowly.”
Then, too, is the issue of U.S. Treasury default under Secretary Janet Yellen. ‘Twould be a week from Monday (05 June) per “Old Yeller”, barring some BandAid and tape resolution. Rating agency Fitch (which always figures to be first) is said to be “considering” a downgrade of its StateSide credit rating. But not to worry: President Biden’s Administration has their “contingency plan” waiting in the wings. (Just mind the “direct deposit” of that Social Security cheque…)
Moreover, the stock market isn’t worried at wit. Money is pouring into the S&P 500 at a pace we’ve not witnessed since we began collecting stock-by-stock MoneyFlow data on a daily basis back in 2005. ‘Course, you can count on one hand the five or so stocks that essentially are the whole S&P 500. But money is money such that by the website’s three measures (weekly, monthly, quarterly) this leading indicator of Flow is unabashedly pointing to much high levels for the Index to go. All that remains to justify it are earnings. (Note: the “live” price/earnings ratio of the S&P 500 settled the week at 55.1x. The good news is that the “parroted” version is but a mere 24.3x). Further, the 3-month U.S. Treasury Bill may yield 5.115% as opposed to the S&P’s 1.607%. But stocks don’t default, right? Even if the money doesn’t exist to cover them, right? (As of yesterday: S&P 500 Market Capitalization = $36.6T; “M2” Money Supply = $20.5T … just in case you’re scoring at home). Have a nice day.
But hardly are the precious metals having nice days. Let’s start with our two-panel graphic for Gold. On the left, the “Baby Blues” of trend consistency cracked below the +80% axis back on 05 April, price then 2037; as of yesterday, ’twas better than -100 points lower at 1936. (Again ad nauseam, “Follow the blues…” given their leading quality). On the right, all those labeled overhead resistors are Gold’s plight in its downward Market Profile flight:
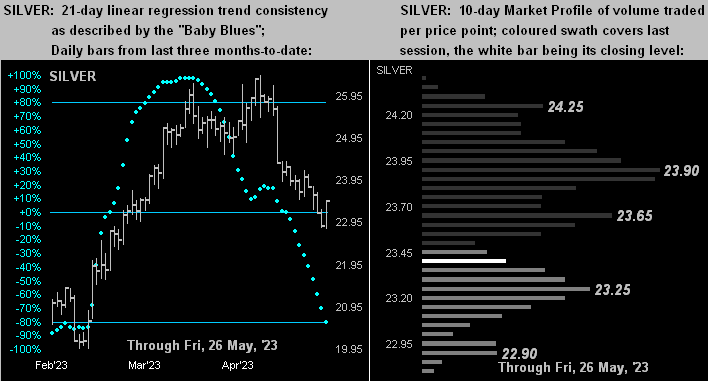
Faring none the better is poor ol’ Sister Silver, her “Baby Blues” (below left) in pure consistent plunge, although in her Market Profile (below right) she’s found some trading support above 23.25. Similar to Gold’s aforeshown support structure, for Silver such support extends down to 19.95, (but please let’s not go there, dear Sister…):
‘To sum it all up, Gold’s being conventionally considered a commodity — versus True Cash — finds it in techncially-negative mode, with the high 1800s in its near-term balance. Doubtless, if there is any resolution for a StateSide default, it shan’t be until “lawmakers worked late with the Administration into Sunday night” (i.e. 04 June), even as ’tis now reported that a tentative agreement has been reached. But that’s just the way Washington operates and it makes for ad-revenue-generating late-night boob tube “breaking news”. Prior to which, we see nothing of substance to break Gold’s downward bent, barring poor employment reports later in the ensuing week. Gold shall naturally run this parabolic Short course as it always does, only to then resume its broader upward climb. And that we trust shall be sublime to a High of All-Time!
Cheers!
…m…
www.TheGoldUpdate.com
www.deMeadville.com
and now on Twitter: @deMeadvillePro
*********

Mark Mead Baillie has had an extensive business career beginning in banking and financial services for two years with Banque Nationale de Paris to corporate research for three years at Barclays Bank and then for six years as an analyst and corporate lender with Société Générale.
For the last 22 years he has expanded his financial expertise by creating his own financial services company, de Meadville International, which comprehensively follows his BEGOS complex of markets (Bond/Euro/Gold/Oil/S&P) and the trading of the futures therein. He is recognized within the financial community of demonstrating creative technical skills that surpass industry standards toward making highly informed market assessments and his work is featured in Merrill Lynch Wealth Management client presentations. He has adapted such skills into becoming the popular author each week of the prolific “The Gold Update” and is known in the financial website community as “mmb” and “deMeadville”.
Mr. Baillie holds a BS in Business from the University of Southern California and an MBA in Finance from Golden Gate University.


