Gold Price - Contango And Tariffs And Fed Oh My!


If as a trader you found this past week to be boring, then 'tis time to hang it up there, Bunky.
Or if on the other hand you suffered from an overdose of analysis paralysis, then hey, we just entered the Dog Days of August: nuthin's gonna happen, so take go take a break - you shan't miss anything, right? (Not).
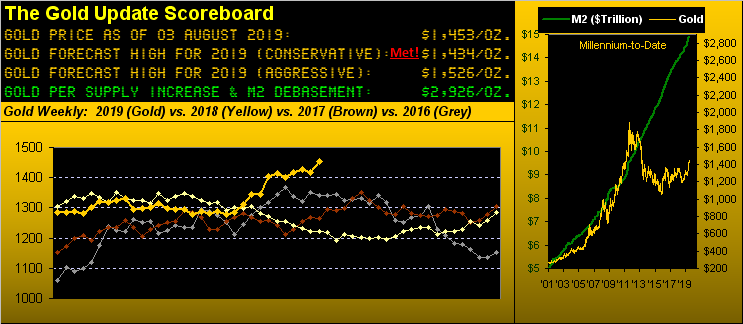
Let's first just stand back for a moment and take a high-level look at the track of Gold in the above Scoreboard. Following five weeks of flatlining, Gold finally got off the schneid and gained 2.4% (+34 points). 'Twas Gold's best week since that ending 22 June.
"But mmb, they added 13 points of that 'contango' thing into the price..."
Indeed "they" (those who don't wish to perhaps pay more for Gold by waiting until December) did, Squire. Yet even exclusive of that, Gold's gain for the week was 1.5% (+21 points), still its best performance since that same date. And from an annual perspective, Gold's having settled out the week yesterday (Friday) at 1453 puts price 8.3% above where 'twas at this point in 2016, 14.9% above where now 'twas in 2017, and 18.9% above this date a year ago. That ain't bad, you know.
But as a single adjective to describe the state of the BEGOS Markets spectrum (Bond / Euro / Gold / Oil / S&P) this past week, 'twould be "FRAGILE!" Be it Federal Reserve Bank Chair Powell sucking the excitement from traders' expectations for multiple rate cuts by instead citing the FedFunds 0.25% rate reduction as merely a "mid-cycle adjustment", or be it renewed TrumpTariffTweets, or be it the unspoken truth that earnings are not maintaining their tax cut growth pace -- indeed all three of those catalysts -- the BEGOS bunch went careening all over the place. As measured against each component's "expected weekly trading range" in points, here's what they actually traced, exceeding the expected in every case:
■ Bond: expected 2 5/32; actual 4 17/32 (+110%); week's change +2.8%
■ Euro: expected 0.01235; actual 0.01385 (+12%); week's change -0.3%
■ Gold: expected 37.7; actual 49.8 (+32%); week's change +2.4%
■ Oil: expected 4.12; actual 5.23 (+27%); week's change -1.7%
■ S&P: expected 67.75; actual 114 (+68%); week's change -2.9%
'Tis said traders love volatility, and yet, be still thy beating heart: for the dogs in these August days may be -- instead of the usual sleepy summer bassets -- high-speed whippets.
And whipped higher per the weekly bars here we've Gold from this time a year ago, the parabolic Long trend now 10 weeks in duration, (the prior Long one having been 24 weeks followed by the wimpy Short trend of 13 weeks). 'Tis tempting to scale the chart upward to show (as in the Scoreboard) our "aggressive" forecast high for this year of 1526. However as we've noted throughout recent missives, this mid-1400s area was price-consternative back in April-May 2013, something which traders may not recall, but which algorithms have stored in core memory. That cited, should we see firm trading 'round 1490, then 1526 becomes very viable before the year is out, indeed quite swiftly so from 1490. But for the present, here are the year-over-year weeklies:

Year-over-year as well, here we've Gold's percentage track along with those of key precious metals equities from best improvement to least: the VanEck Vectors Gold Miners exchange-traded fund (GDX) is +33%; Agnico Eagle Mines (AEM) is +31%; Franco-Nevada (FNV) is +23%; Gold itself as noted is +19%; the Global X Silver Miners exchange-traded fund (SIL) is now positive at +3%; Newmont Mining Goldcorp (NEM) is +2%; and Pan American Silver (PAAS) which year-over-year a month ago was -26%, has roared back to now just -2%. What a difference one month can make, eh?
As well it being month-end plus two trading days into August, here's how the BEGOS Markets stand year-to-date. And remember Silver's being perennially buried in last place? "Not anymohhhrrre...":
Now to the ever-descending Economic Barometer, the broad implication for which ought be an ever-ascending Gold price, driven as ever by debased currencies. But did the Fed really need to cut? After all, our recent first peek at Q2 Gross Domestic Product put annualized growth at +2.1%. The average GDP growth during the three years of the Fed's rate hike cycle from December 2015 through December 2018 was +2.4%; thus we've slowed a bit. But 'tis interesting to see the Fed appearing more proactive than reactive: perhaps a bit of elbowing from Pennsylvania Avenue to the lads and lasses over there on Constitution Avenue. In fact our real concern remains the graphical difference between the high level of the S&P 500 and low level of the Econ Baro. To be sure, the Great Tax Cut of 2018 has run its course with respect to corporate earnings. Thus far in Q2 Earnings Season with 361 of the S&P 500 companies having reported, only 65% have bettered their bottom lines from a year ago. That compares in 2018 to 85% having bettered their Q2 over those of pre-tax cut 2017's Q2. As to our "live" price/earnings ratio for the S&P? 34.1x. "Yikes" ad nausea. And lying in wait is the signature to approve some $1.3 trillion in additional StateSide debt. Got Gold??? Dumb question, that. Here's the Baro:
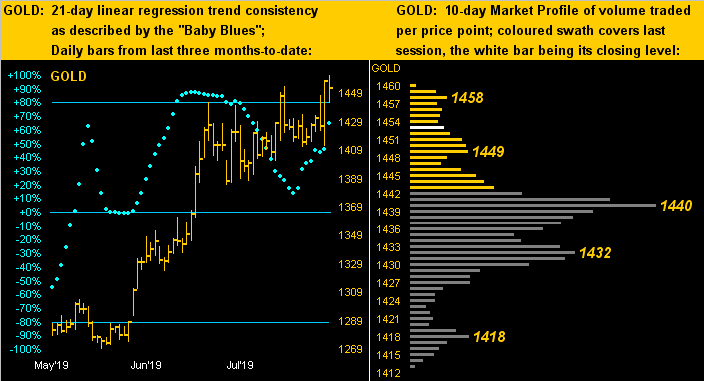
On to our two-panel graphic of Gold's daily bars from three months ago-to-date on the left and the 10-day Market Profile on the right. And seeing the baby blue dots of linear regression trend consistency themselves having turned erratic, be wary of price swings, too, turning dramatic. Again, Gold is now up into that aforementioned mid-1400s area of consternation from six years ago, so 'tis critical through here to prudently manage one's cash. Helpful may be the Market Ranges page at the website. And as for guidance from the Profile, its line in the sand now stands at 1440:
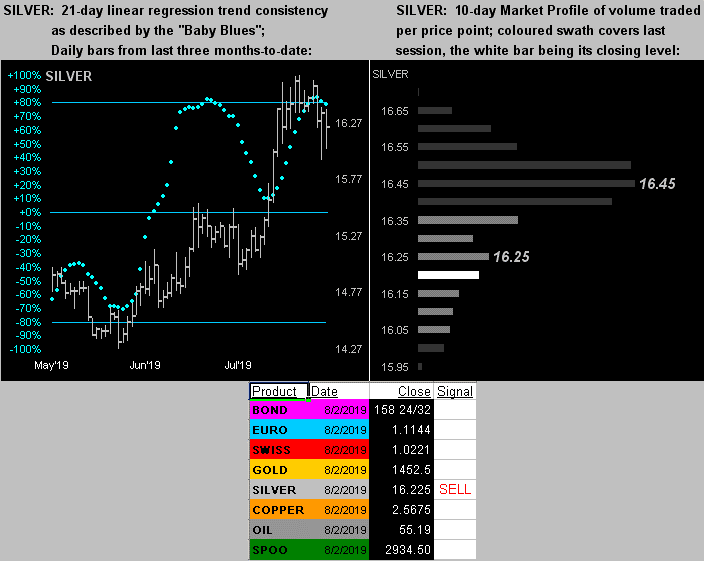
Silver's like display is more daunting. Yes, she's out-accelerated Gold of late on the upside, which she provenly can so do on the downside. And per her "Baby Blues" (at left), they've just kinked beneath their +80 horizontal axis which technically suggests lower levels are coming per the table at the foot of the graphic. Moreover, price is now below the Profile's dominant trading apex (at right) of 16.45. How low might Sister Silver go? Structural support is in the mid-15s:
For this week's wrap with another month in the books, here is Gold's broad-based structure chart by the monthly bars since September 2011's All-Time High. And 'tis been years since this chart has looked this good, (which for you superstitious WestPalmBeachers down there means 'tis all over). Gold on Friday reached up to 1462: just four wee points from poking its head above the "sous-sol" (basement) to peek out upon The Floor at 1466, that zone not traded since 09 May 2013 (which for those of you scoring at home was 1,570 sessions ago). Now if Silver does indeed pull back through here, it may be some time as well before we'll see Gold "Dancing on The Floor"--(Third World, '81). But keep those shoes shined, for the party is inevitable!

www.deMeadville.com
www.TheGoldUpdate.com
********

Mark Mead Baillie has had an extensive business career beginning in banking and financial services for two years with Banque Nationale de Paris to corporate research for three years at Barclays Bank and then for six years as an analyst and corporate lender with Société Générale.
For the last 22 years he has expanded his financial expertise by creating his own financial services company, de Meadville International, which comprehensively follows his BEGOS complex of markets (Bond/Euro/Gold/Oil/S&P) and the trading of the futures therein. He is recognized within the financial community of demonstrating creative technical skills that surpass industry standards toward making highly informed market assessments and his work is featured in Merrill Lynch Wealth Management client presentations. He has adapted such skills into becoming the popular author each week of the prolific “The Gold Update” and is known in the financial website community as “mmb” and “deMeadville”.
Mr. Baillie holds a BS in Business from the University of Southern California and an MBA in Finance from Golden Gate University.


