Gold Price Exclusive Update


Our proprietary cycle indicator is down many months lower.
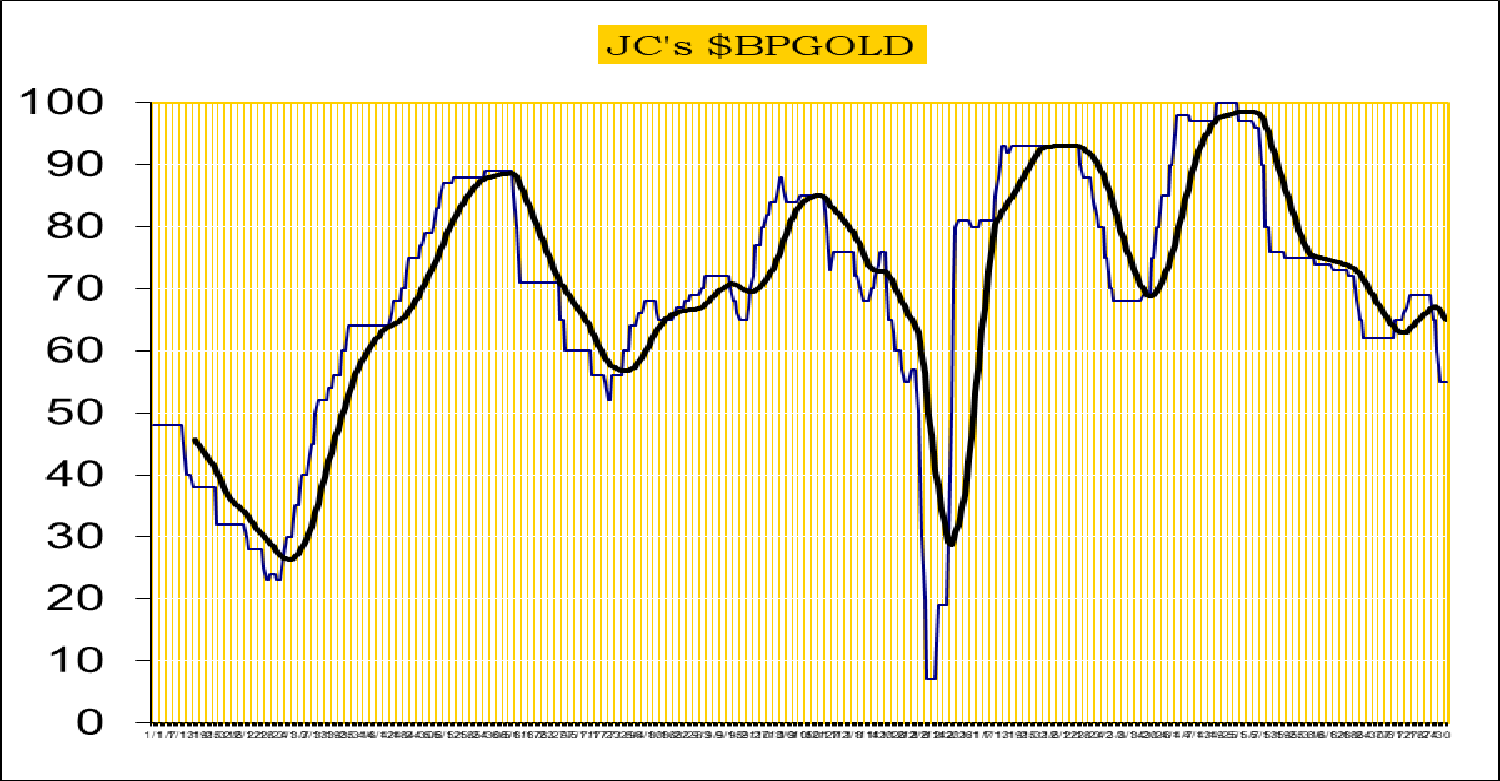
To public readers of our updates, our cycle indicator is one of the most effective timing tool for traders and investors. It is not perfect, because periodically the market can be more volatile and can result in short term whipsaws. But overall, the cycle indicator provides us with a clear direction how we should be speculating.
Investors
During a major buy signal, investors can accumulate positions by cost averaging at cycle bottoms, ideally when prices are at or near the daily 200ema.
During a major sell signal, investors should be hedged or in cash.
Traders
Simply cost average in at cycle bottoms when prices are at or near the daily 200ema; and cost average out at cycle tops when prices are above the daily 50ema.
Gold sector remains on long-term buy at the end of October.
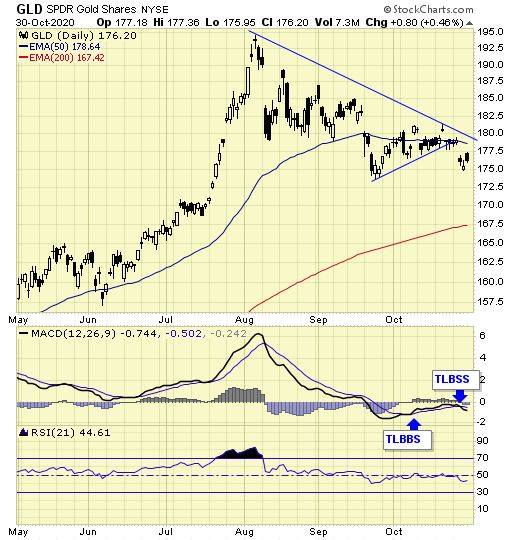
GLD is on short-term sell signal.
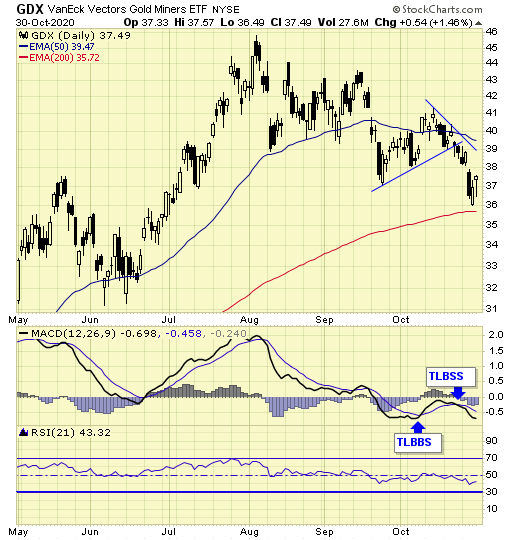
GDX is on short-term sell signal.
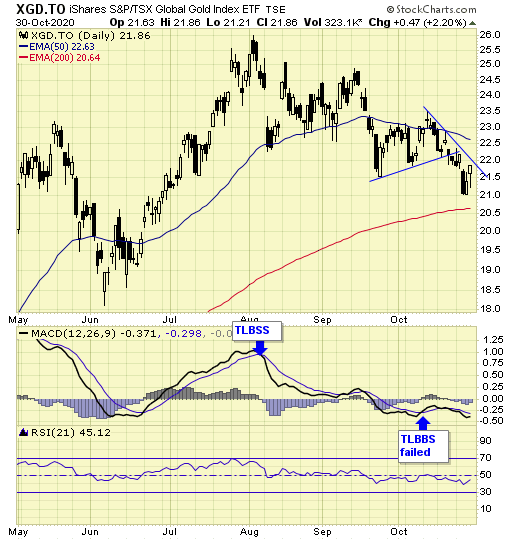
XGD.to is on short-term sell signal.
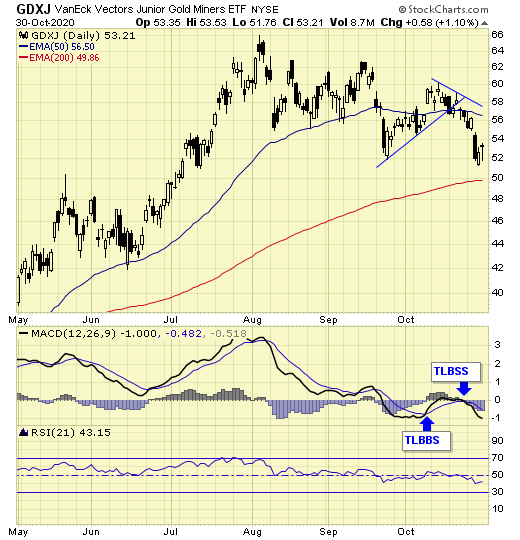
GDXJ is on short-term sell signal.
Analysis

Our ratio is on sell signal.
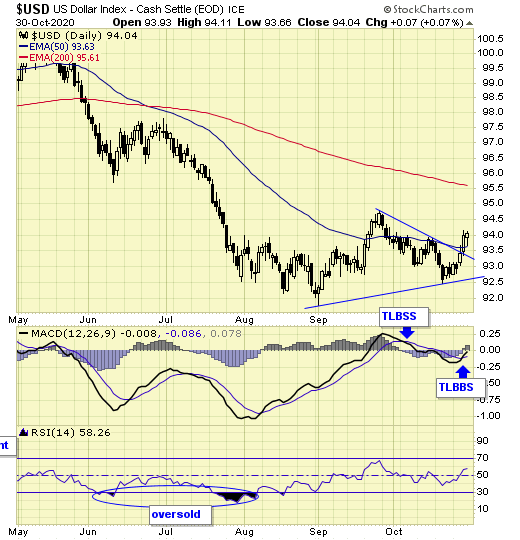
USD – on buy signal.
A bouncing dollar pressures the metals.
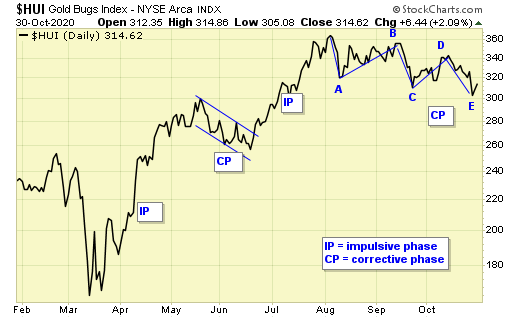
The correction which started in August has extended into a five wave zigzag pattern.
Corrective patterns can be 3 waves and 5 waves.
Bull markets have clear impulsive and corrective phases, and the current corrective phase should be at or near completion.
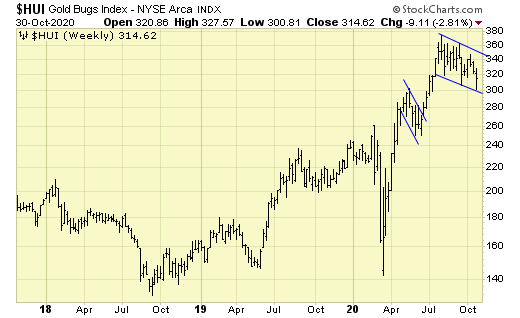
On the weekly chart, a bull flag is in progress.
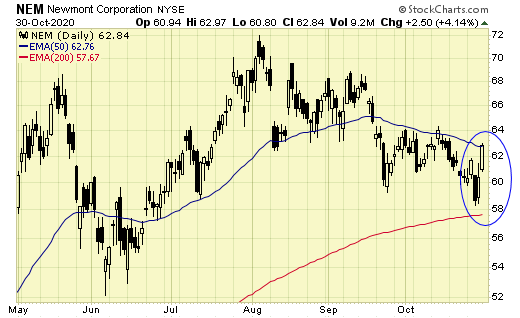
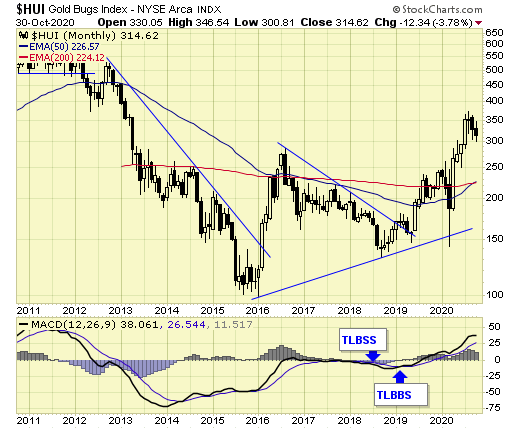
Newmont, the flagship of gold mining stocks, reversed up nicely near the 200ema.
A five wave zigzag corrective pattern also.
Note: we have no positions or hold any interests in Newmont mining, this chart is for analysis only.
Summary
Long-term – on major buy signal.
Short-term – on mixed signals.
Gold sector cycle is down.
The multi month correction is at or near completion.
$$$ We are holding long and short term positions.
Disclosure
We do not offer predictions or forecasts for the markets. What you see here is our simple trading model which provides us the signals and set ups to be either long, short, or in cash at any given time. Entry points and stops are provided in real time to subscribers, therefore, this update may not reflect our current positions in the markets. Trade at your own discretion.

Jack Chan is the editor of Simply Profits, established in 2006. Chan bought his first mining stock, Hoko Exploration, in 1979, and has been active in the markets for the past 37 years. Technical analysis has helped him filter out the noise and focus on the when, and leave the why to the fundamental analysts. His proprietary trading models have enabled him to identify the NASDAQ top in 2000, the new gold bull market in 2001, the stock market top in 2007, and the US dollar bottom in 2011.


