Gold Price Forecast – Is The Carnage Over?


How formidable a setback have gold prices suffered last week – is the heavy selling over? Prices have been recovering, perhaps new all-time highs are next – or not before a sizable decline.
So, how do these two scenarios square against each other? In today's article, we'll examine gold performance and how it relates to the very recent corona panic lessons, and take you through the lessons from its no less spectacular moments.
Gold continues to trade very similarly to how it did in early March, and the 4-hour candlestick chart shows the details.
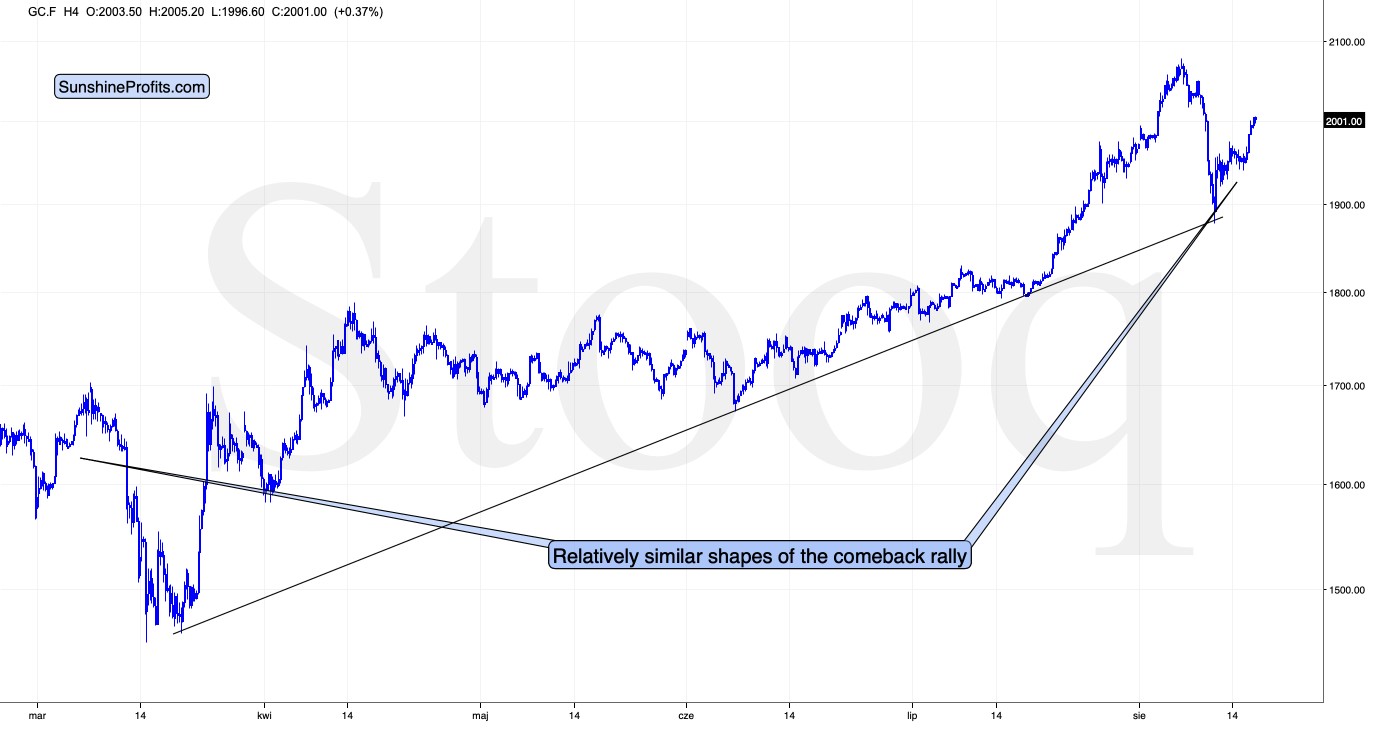
Right after the bottom, we saw a sharp – and limited – rebound in both cases: in early March and right now. What happened next in March, was a small decline that was then followed by a sharp rally. We saw more or less the same thing this time, the difference being that now, the current immediate-term move is not huge. It could easily be the case that this move higher is not big yet, and the similarity-based rally unfolds later this week.
The continuation of the pattern would likely lead to a re-test of the previous highs, and perhaps a tiny move above them. Let’s keep in mind that it’s not only the similarity to the first quarter of this year suggests this kind of topping pattern, but also the analogy to how gold topped in 2011.
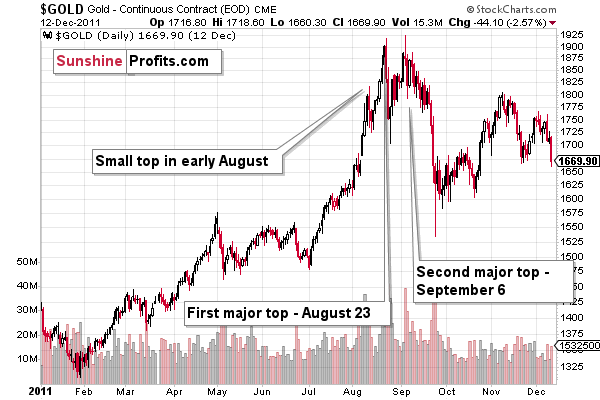
On the above chart you can also see that the pace at which gold corrected upward before the final (second) top, was slightly smaller than the pace at which gold declined from the first top. Consequently, seeing this kind of action right now is not a reason to be concerned. Even if gold moves slightly above the previous 2020 high this week, the short-term outlook would likely remain bearish.
The next support is at $1,700, which is where – approximately – gold topped and bottomed multiple times earlier this year.
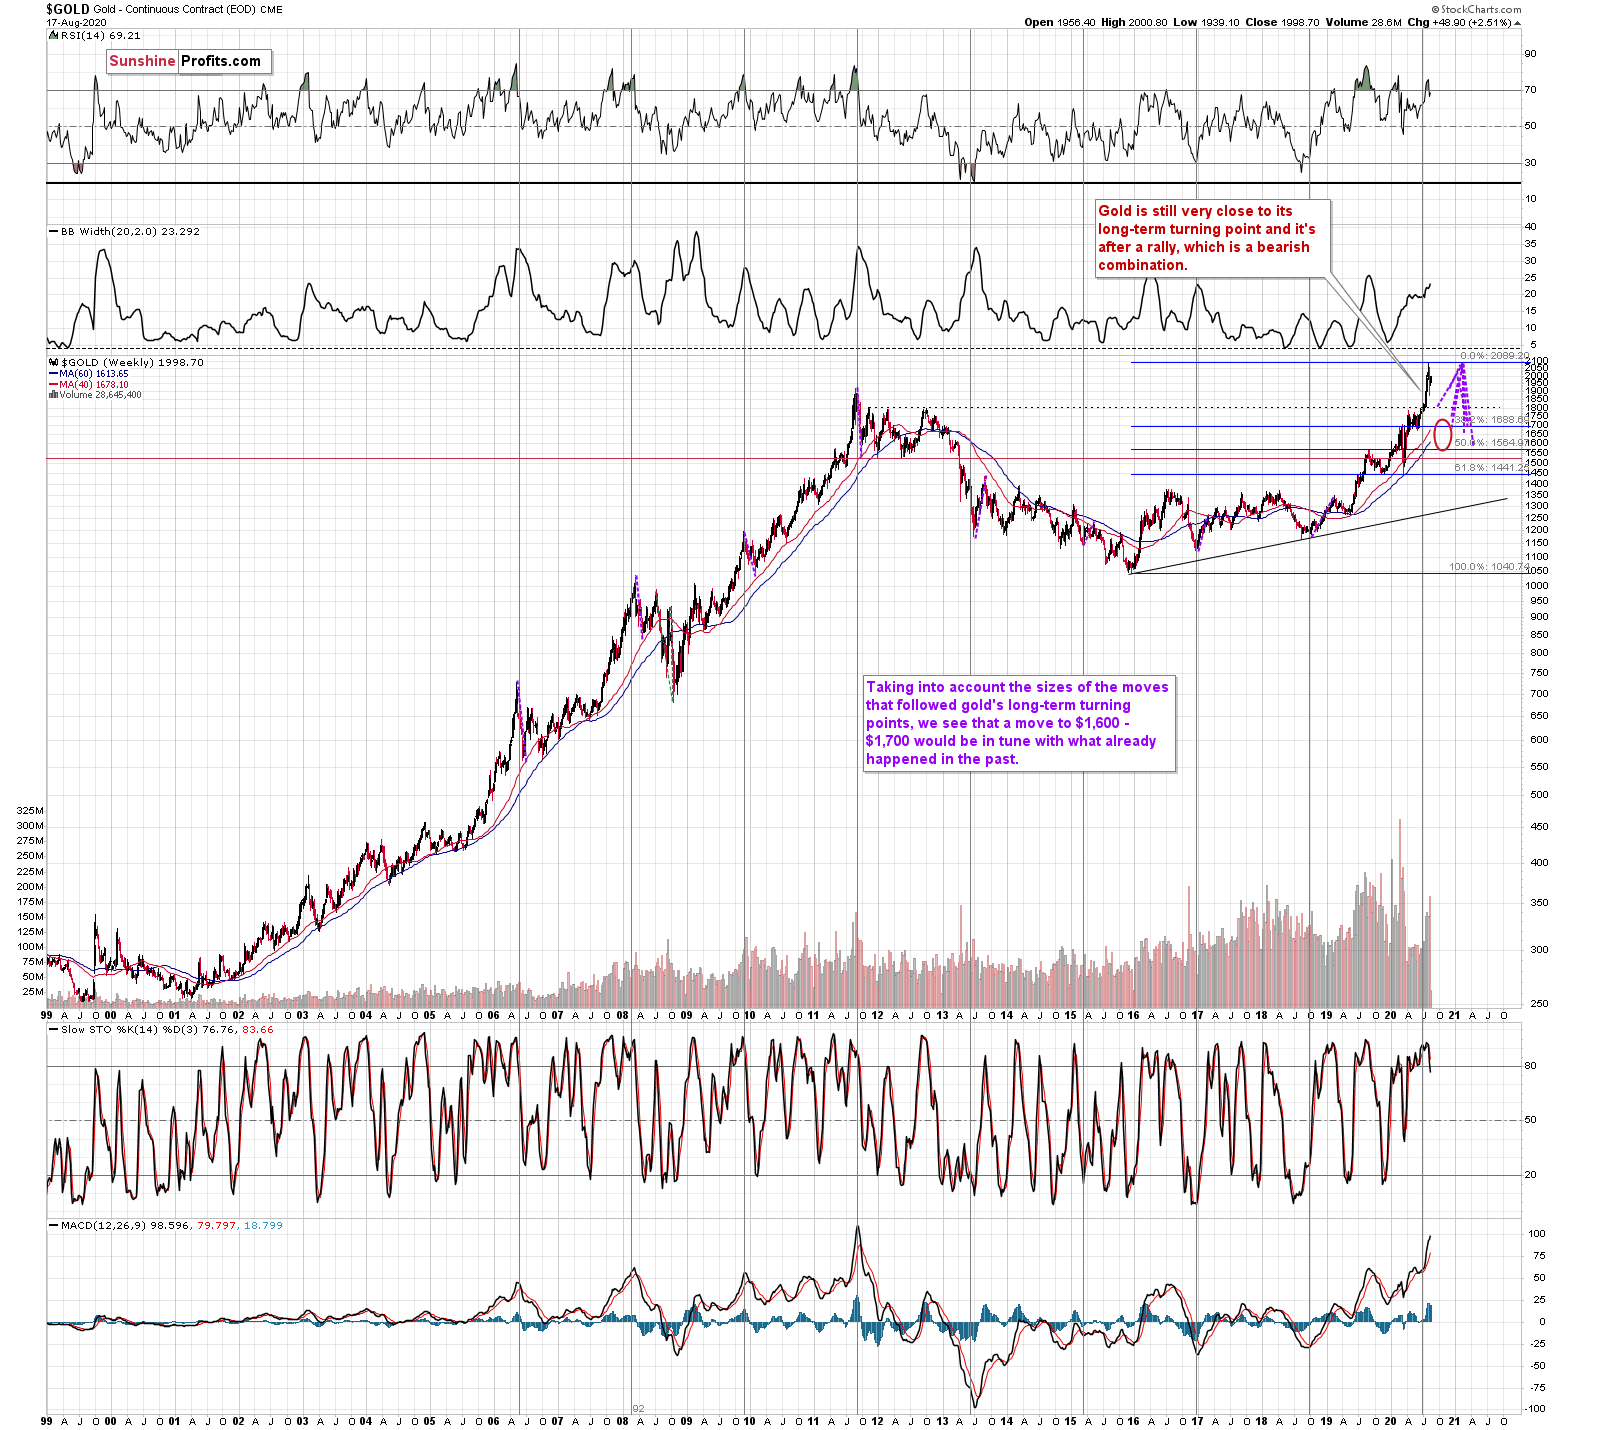
The $1,700 level is additionally confirmed by the 61.8% Fibonacci retracement based on the entire 2015 – 2020 rally.
There’s also possibility that gold would decline to the $1,500 - $1,600 area or so (50% Fibonacci retracement and the price level to which gold declined initially in 2011), but based on the size of the recent upswing, we no longer think that this scenario is the most likely one.
Gold’s very long-term turning point is here and since the most recent move has definitely been to the upside, its implications are bearish.
We used the purple lines to mark the previous price moves that followed gold's long-term turning points, and we copied them to the current situation. We copied both the rallies and declines, which is why it seems that some moves would suggest that gold moves back in time - the point is to show how important the turning point is in general.
The big change here is that due to gold’s big rally, we moved our downside target for it higher. Based on the information that we have available right now, it seems likely that gold will bottom close to the $1,700 level. That’s very much in tune with how much gold moved after the previous long-term turning points.
Also, while we’re discussing the long-term charts, please note the most important detail that you can see on the gold, silver, and mining stock charts, is hidden in plain sight. Please note how much silver and miners rallied.
The analogy to the price moves after the previous turning points didn’t change, but since the starting point is much higher, the downside target is also higher.
Speaking of upside targets, two weeks ago, we wrote the following:
Based on gold's Fibonacci extensions and the previous major highs and lows (the 2018 high and late-2019 low along with the 2020 low), we get a nearby upside target of $2085. At the moment of writing these words, gold is trading at $2044. Given this week's volatility, it could even be a matter of hours before gold reaches the above-mentioned target and reverses. Taking closing prices into account, gold is up by $35, so if it reverses significantly, we would be likely to see a powerful weekly reversal candlestick and one that causes gold to decline in the following weeks.
That’s more or less what happened. Gold topped at $2,089.20.
Summary
Despite the encouraging rebound during recent sessions, the yellow metal isn't out of the woods yet. Far from it, actually – and the 2011 top analogy proves that. Reflecting several Fibonacci retracements, the target of $1,700 appears likely before the king of metals continues higher on a lasting basis.
The following days are not likely to be pleasant times for anyone who refuses to jump on the bullish bandwagon just because prices moved higher in the previous months. But what’s profitable is rarely the thing that feels good initially. As silver often moves in close relation to the king of metals, forecasting gold’s rally without a bigger decline first is thus likely to be misleading. The times when gold is lastingly trading well above the 2011 highs will come, but they are unlikely to be seen without being preceded by a sharp drop first.
Naturally, the above is up-to-date at the moment of publishing and the situation may – and is likely to – change in the future. If you’d like to receive follow-ups to the above analysis, we invite you to sign up to our gold newsletter. You’ll receive our articles for free and if you don’t like them, you can unsubscribe in just a few seconds. Sign up today.
Przemyslaw Radomski, CFA
Editor-in-chief, Gold & Silver Fund Manager
Sunshine Profits - Effective Investments through Diligence and Care
* * * * *
All essays, research and information found above represent analyses and opinions of Przemyslaw Radomski, CFA and Sunshine Profits' associates only. As such, it may prove wrong and be subject to change without notice. Opinions and analyses are based on data available to authors of respective essays at the time of writing. Although the information provided above is based on careful research and sources that are deemed to be accurate, Przemyslaw Radomski, CFA and his associates do not guarantee the accuracy or thoroughness of the data or information reported. The opinions published above are neither an offer nor a recommendation to purchase or sell any securities. Mr. Radomski is not a Registered Securities Advisor. By reading Przemyslaw Radomski's, CFA reports you fully agree that he will not be held responsible or liable for any decisions you make regarding any information provided in these reports. Investing, trading and speculation in any financial markets may involve high risk of loss. Przemyslaw Radomski, CFA, Sunshine Profits' employees and affiliates as well as members of their families may have a short or long position in any securities, including those mentioned in any of the reports or essays, and may make additional purchases and/or sales of those securities without notice.
 Przemyslaw Radomski, CFA, is the founder, owner and the main editor of SunshineProfits.com. You can reach Przemyslaw at: http://www.sunshineprofits.com/help/contact-us/.


