Gold Price Forecast – Targets For Backing Up The Truck On Gold


Gold has been trading wildly recently. And little wonder, considering the global hunt for liquidity. Where shall the indiscriminate selling stop? In other words, the million-dollar question is, how low could gold go during this decline, and what’s the most likely price level at which the buying opportunity will present itself with an excellent risk to reward ratio.
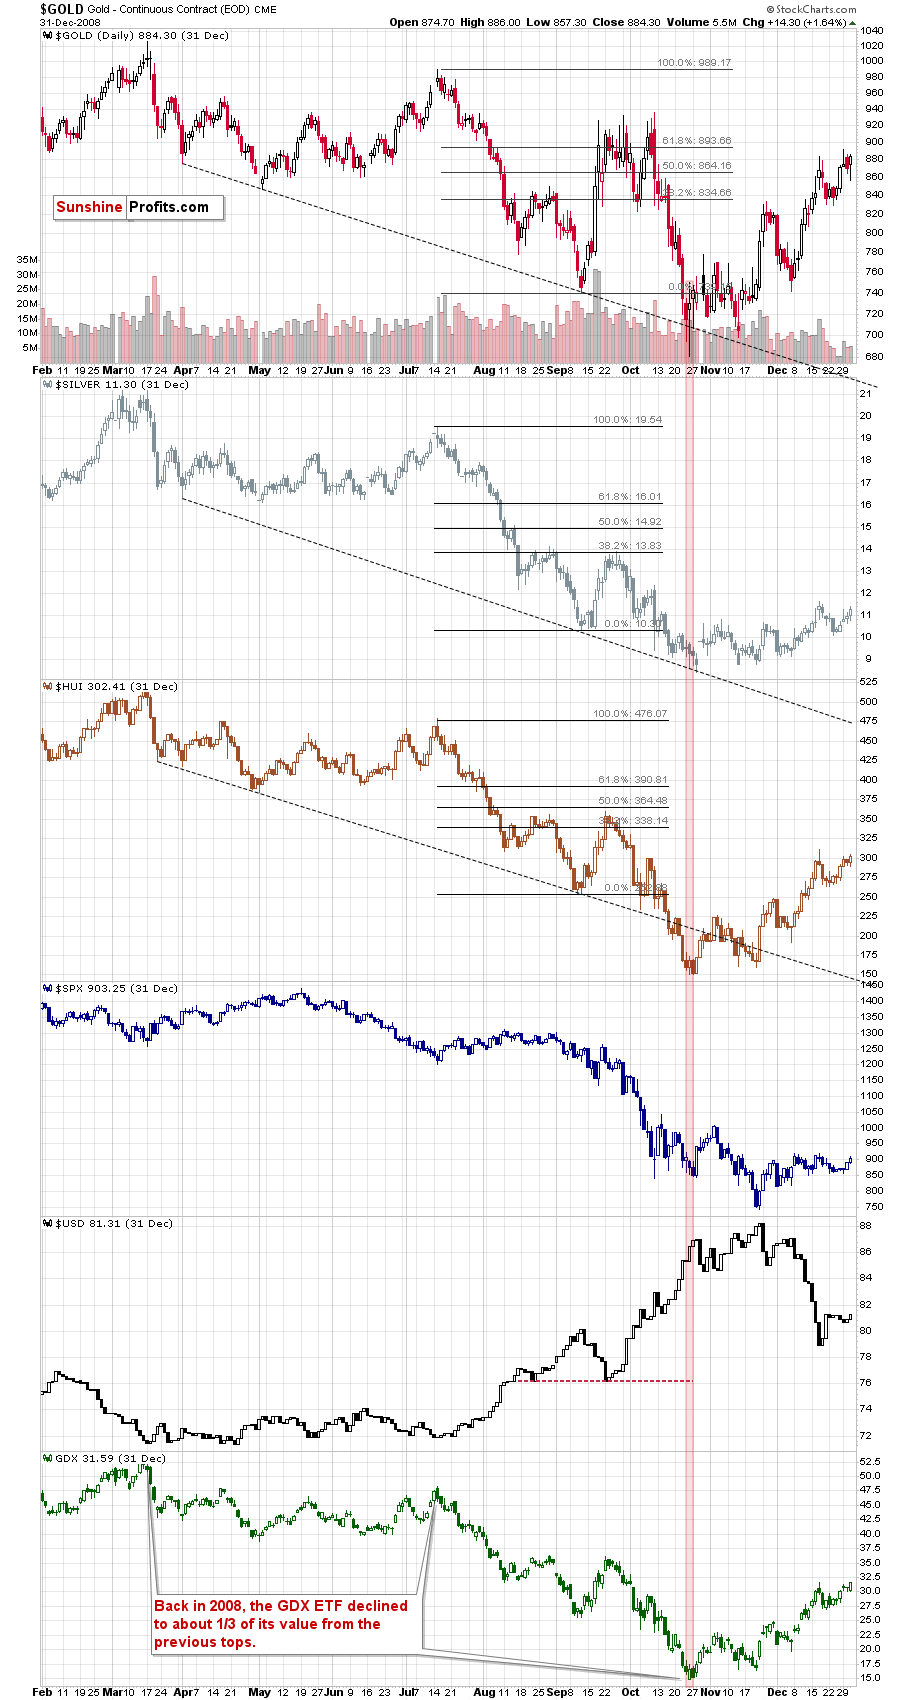
In short, in our opinion, gold is likely to decline in a volatile manner, until it breaks below the declining support line that is based on the most recent two lows. Just like it did in 2008. Please take a look at the chart below for details.
The very important confirmation of the usefulness of this trading technique comes from the 2012-2013 slide.
Over a year ago, we created a chart based on the possible similarity of the final slide in the PMs to the 2012-2013 slide. We wrote comments on it and we called them “Letters” to the future investors. While the situation is not as similar to the 2012-2013 slide, as it is to the 2008 one, this chart seems useful anyway.
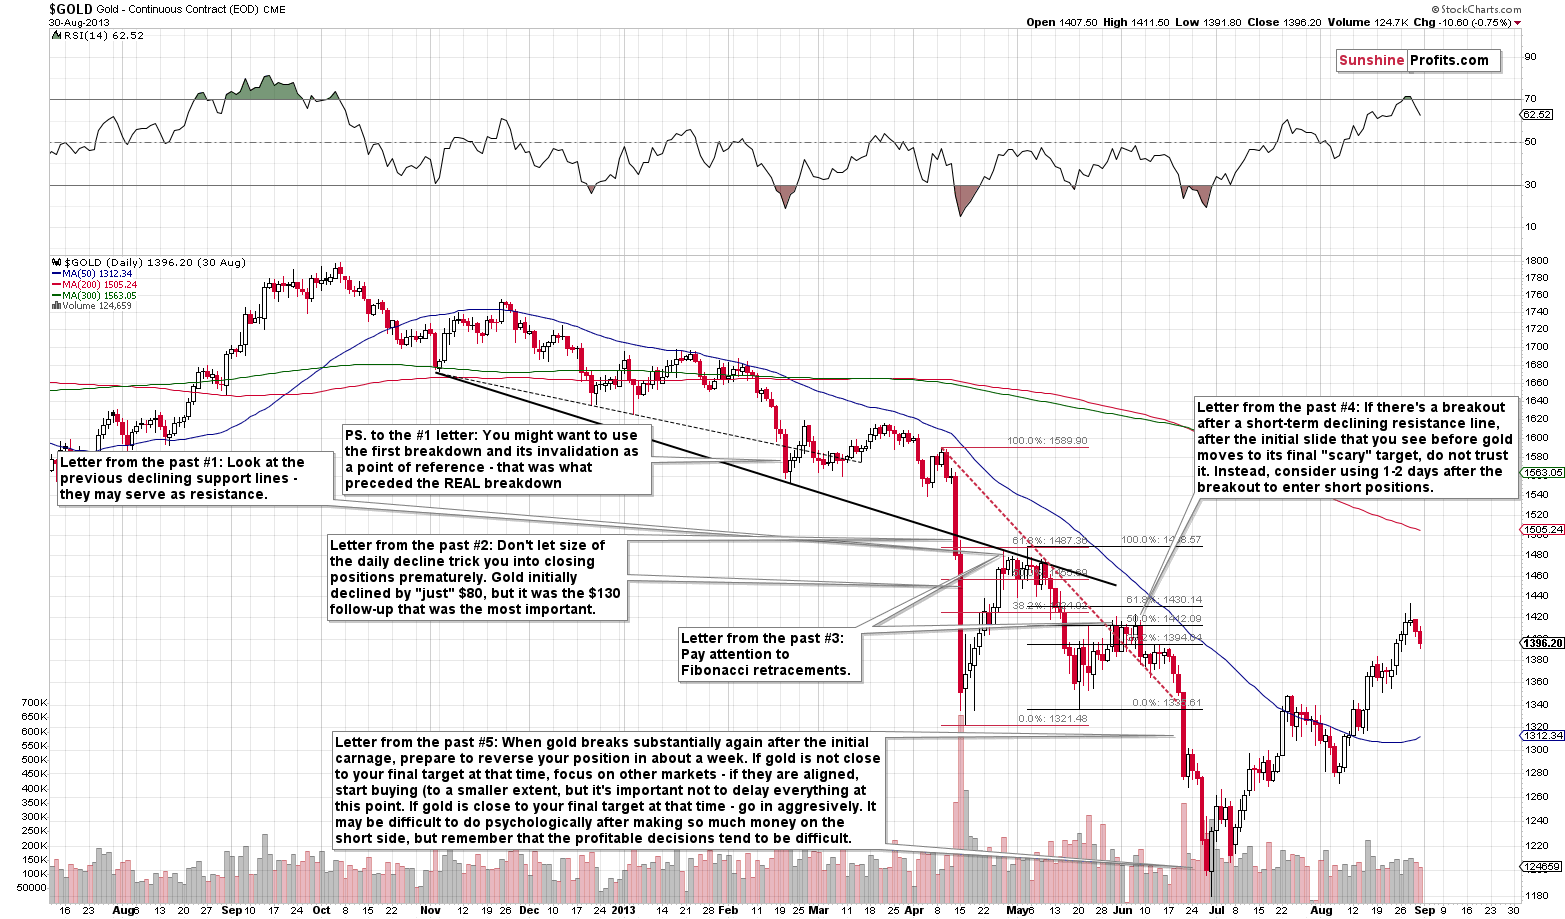
The key thing visible above is the slide well below the declining support line that was based on the previous local lows. It’s not that important how much gold broke below this line, but that it provided a great temporary buying opportunity just a day after the breakdown.
This is very similar to what we see on the 2008 gold chart.
Now, the 2008 decline was faster (overall) than the 2013 decline, and the current slide is even faster, so it seems that it would not take two trading days to form the bottom after the breakdown, but that it would rather take place on the intraday basis.
- The area marked with red rectangle – the bottom in gold – was characterized by a clear show of strength in gold. Gold reversed and closed the day higher despite a move higher in the USD Index. We will be on a lookout for this kind of confirmation as it might prove extremely important also this time.
- The precious metals market formed its final bottom, when stocks formed their local bottom at their previous local low. This might be a useful clue, but it doesn’t have to be. It’s not as important as the previous point.
- The precious metals market bottomed after the USD Index was already after a sizable rally, but it didn’t wait for the USD Index to form its top. The relative strength was the critical sign – waiting for the USDX to reach its target or critical resistance level was not that important. Consequently, the first two points seem most important.
- Silver and mining stocks bottomed along with gold and silver bottomed practically right at is declining support line while miners – just like gold – broke temporarily below it. In case of the miners, the breakdown was not immediately invalidated, though.
The first point is what we are going to apply to the current technical picture and we’re going to use the remaining ones as confirmations.
Connecting the previous two lows in gold, provide us with a very quickly descending line that’s going to be between $1,300 and $1,350 this week and even lower next week.
The interpretation is simple. Once gold breaks below this line, it creates a buying opportunity.
However, just in case gold drops heavily below this line (like it did in 2013), it will be better to wait for some kind of confirmation before saying that the bottom is definitely in (or at least most likely in). This could come in the form of silver or miners reaching their target levels, or it could be based on gold’s strength relative to the USD Index. Please note that since the price moves are likely to be quicker, we might need to consider intraday strength or weakness of gold relative to the USDX, instead of the one based on the daily price changes.
If gold is to slide below the support line, then the odds are that the rebound would be triggered by some other support. Let’s see what kind of strong support levels gold has just below the $1,300 - $1,350 area.
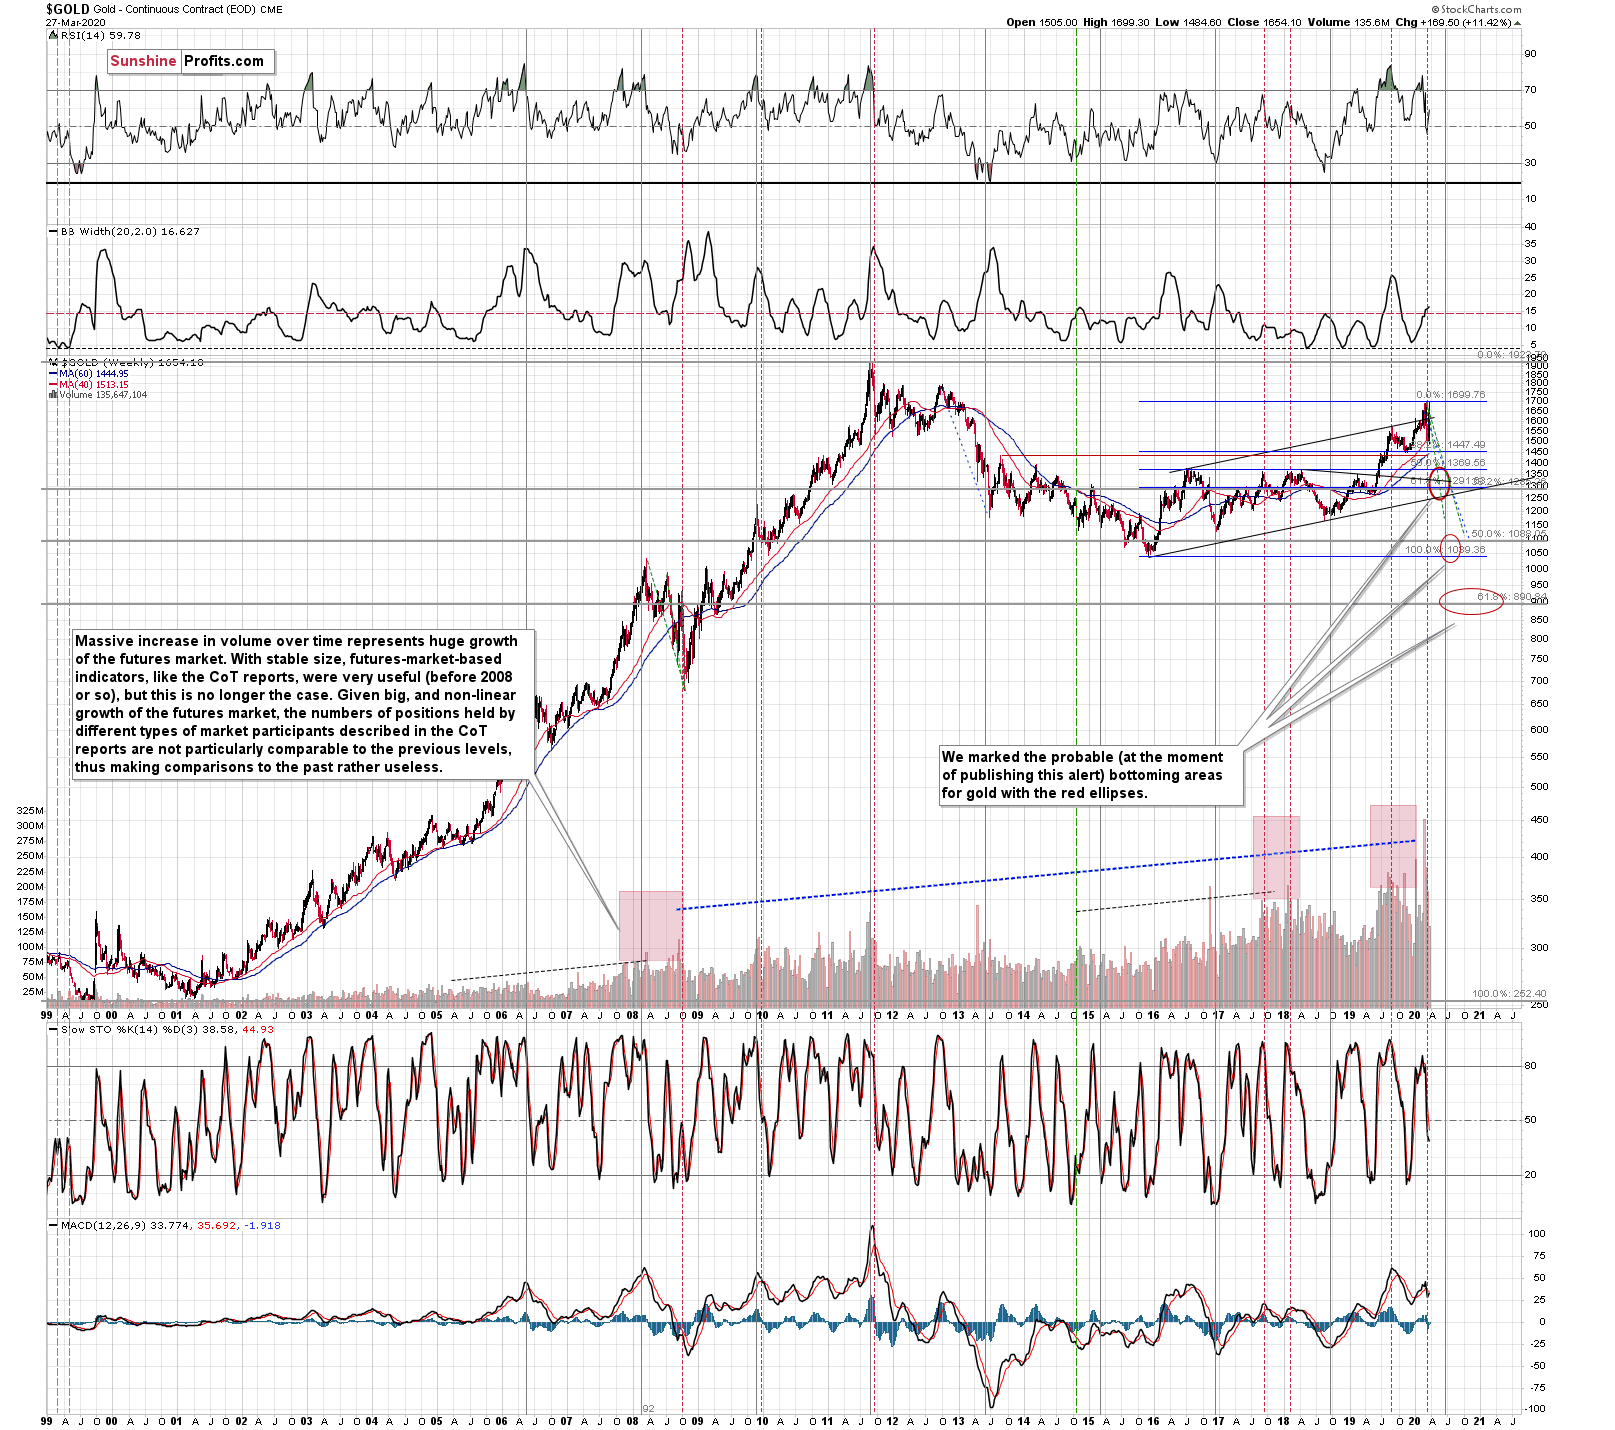
There are three support levels that fulfill the above-mentioned requirement but that are still relatively close to the sharply declining support line:
- The 61.8% Fibonacci retracement based on the 2015 – 2020 rally (at about $1,290)
- The rising medium-term support line based on the 2015 and 2018 lows (currently at about $1,250)
- The 2019 bottom of about $1,270
There’s also the support provided by the 2018 lows at about $1,170, which we view as maximum size of the next short-term decline. As you can see, taking also the $1,170 the discrepancy between the highest and lowest support levels is quite high – that’s why bullish confirmations will be so important.
Summary
There’s a strong case to be made that gold is relatively close to making a major bottom – perhaps THE bottom. Should it be so, then it’s reasonable to expect it to break below the declining line that one gets by connecting its recent lows. This means that gold is likely to slide below $1,350 before it truly bottoms. The area below is reinforced by several strong supports, namely the 61.8% Fibonacci retracement based on the 2015-2020 rally, the rising medium-term support line based on the 2015 and 2018 lows, and the 2019 bottom. Then, there’s also the support offered by the 2018 lows, which is slightly below $1,200.
These levels would mark a buying opportunity. The following days are not likely to be pleasant times for anyone who refuses to jump on the bullish bandwagon just because prices moved higher in the previous months. But what’s profitable is rarely the thing that feels good initially. As silver often moves in close relation to the king of metals, forecasting gold’s rally without a bigger decline first is thus likely to be misleading. The times when gold is trading well above the 2011 highs will come, but they are unlikely to be seen without being preceded by a sharp drop first.
Naturally, the above is up-to-date at the moment of publishing and the situation may – and is likely to – change in the future. If you’d like to receive follow-ups to the above analysis, we invite you to sign up to our gold newsletter. You’ll receive our articles for free and if you don’t like them, you can unsubscribe in just a few seconds. Sign up today.
Przemyslaw Radomski, CFA
Editor-in-chief, Gold & Silver Fund Manager
Sunshine Profits - Effective Investments through Diligence and Care
* * * * *
All essays, research and information found above represent analyses and opinions of Przemyslaw Radomski, CFA and Sunshine Profits' associates only. As such, it may prove wrong and be subject to change without notice. Opinions and analyses are based on data available to authors of respective essays at the time of writing. Although the information provided above is based on careful research and sources that are deemed to be accurate, Przemyslaw Radomski, CFA and his associates do not guarantee the accuracy or thoroughness of the data or information reported. The opinions published above are neither an offer nor a recommendation to purchase or sell any securities. Mr. Radomski is not a Registered Securities Advisor. By reading Przemyslaw Radomski's, CFA reports you fully agree that he will not be held responsible or liable for any decisions you make regarding any information provided in these reports. Investing, trading and speculation in any financial markets may involve high risk of loss. Przemyslaw Radomski, CFA, Sunshine Profits' employees and affiliates as well as members of their families may have a short or long position in any securities, including those mentioned in any of the reports or essays, and may make additional purchases and/or sales of those securities without notice.
 Przemyslaw Radomski, CFA, is the founder, owner and the main editor of SunshineProfits.com. You can reach Przemyslaw at: http://www.sunshineprofits.com/help/contact-us/.
More from Gold-Eagle


