Gold Price Forecast: All-Time High Breakout Underway


Gold has just broken out to a new all-time high, eclipsing the former peak of $1,920 set on September 6, 2011. As this article is going to press, gold is trading at $1,983 in the worldwide spot market.
This is a huge moment for gold. All-time highs do not occur every day, nor every year, nor even every decade for the historic store of wealth.
What now? Will gold make a second long-term peak as it did in 2011 and enter another multi-year decline? Or is there a sustainable bull market ahead?
In this article, we will examine the historical precedents for gold as it has broken former all-time highs, and then calculate realistic expectations for the price of gold over the next year based on an observable price pattern.
All-Time Breakouts Are Rare
Breakouts above former multi-year all-time highs in the gold market are rare. In fact, there have only been three such breakouts previously in the freely-traded era: 1976, 2007, and 2009.
1976 – Gold Breaks Out During Stagflation
Gold has been trading freely since only 1971, when the dollar was severed from any metal backing under the Nixon administration. During that year, gold was trading at $35 per troy ounce.
During gold’s first run following the 1971 severing, the precious metal advanced from $35 to $195 in just three years, peaking in December 1974. This was the first new all-time high peak for gold, and it occurred during the stagflationary backdrop of limited economic growth coupled with high inflation which followed the United States’ unwinnable war in Vietnam.
From the 1974 peak, gold fell nearly 50% to just above $100 by 1976, before recovering those losses into 1978.
Then in July 1978, gold finally broke its former 1974 all-time high of $195.
From that point forward, the pathway for gold was as follows:
- Initial surge up to $215
- 9% correction back to $198
- 25% advance up to $240
- 20% correction back to $193
From that point, the resumption of the bull market continued, as gold rose over 350% to $870 per ounce by January, 1980.
This series of events (a – d) as gold broke its 1974 multi-year all-time high is illustrated below:
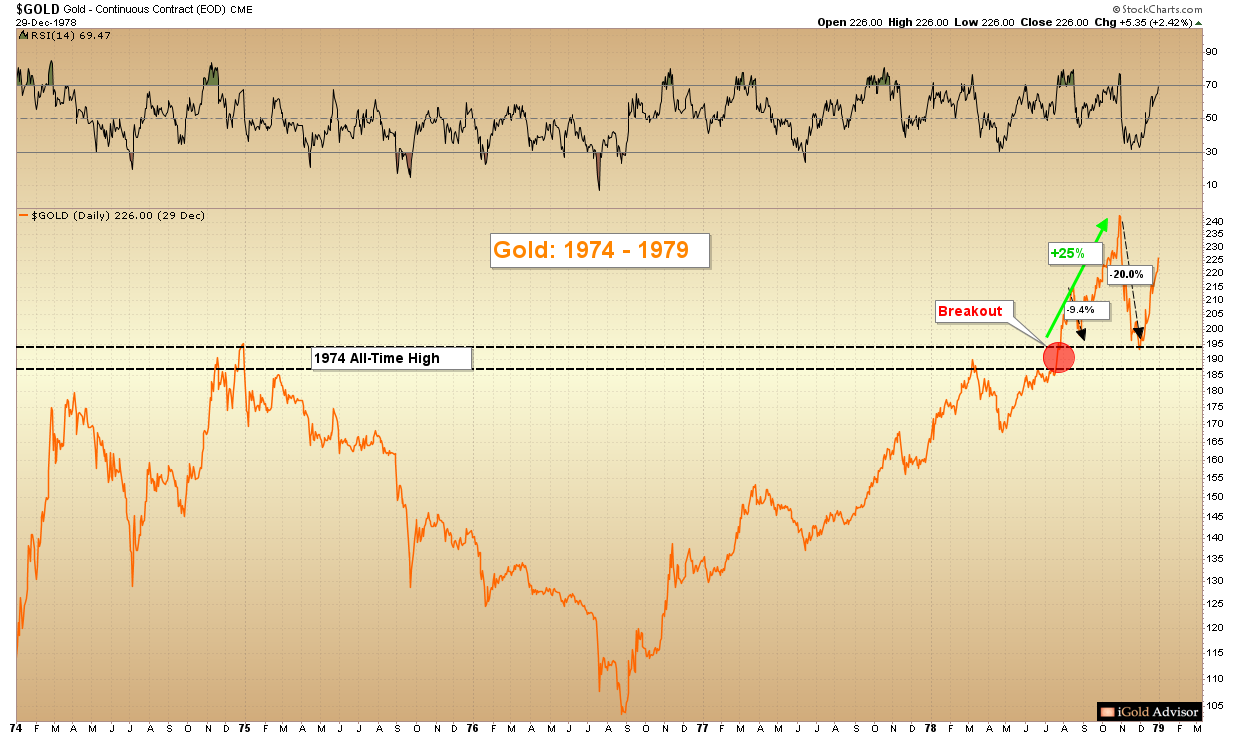
The critical takeaway?
Gold saw two corrections back down to its breakout point, before the bull market resumed.
2007 – Gold Breaks Out Before Global Financial Crisis
Incredibly, gold consolidated for 28 years from 1980 through 2008 below the $870 mark. Then, amidst the prelude to 2008’s global financial crisis, gold finally eclipsed its 1980 all-time high in January 2008.
From that point, the pathway for gold was as follows:
- Initial surge up to $916
- 7% correction back to $850
- 15% advance up to $1,033
- 18% correction back to $846
This series of events (a – d) as gold broke its multi-year all-time high is illustrated below:
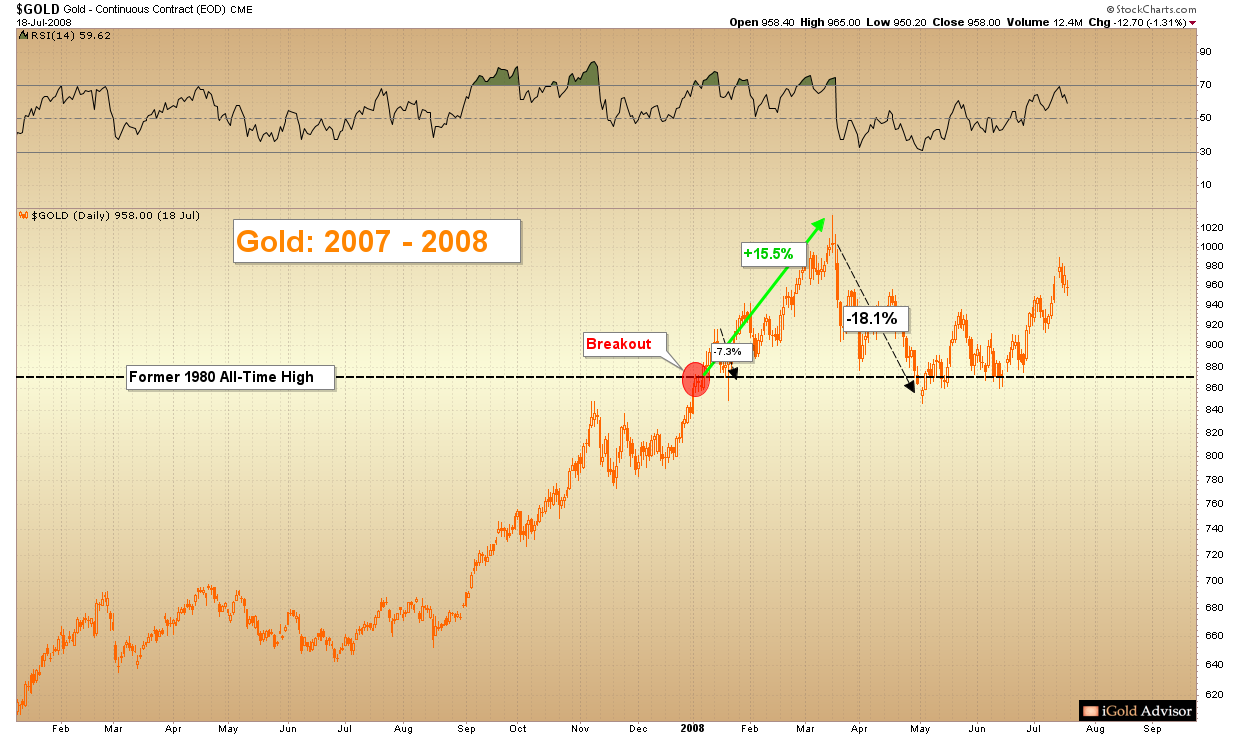
The critical takeaway?
Gold saw two corrections back down to its breakout point, before the bull market could resume.
2009 – Gold Breaks Out as Fed Bails Out Financial System
Following the global financial crisis of 2008, the Federal Reserve printed trillions of dollars to both directly and indirectly bail out the financial system.
The result?
High inflation.
And as we know, precious metals thrive in an inflationary environment.
Gold thus broke its former March 2008 peak of $1,033 per ounce in October 2009.
From that point, the pathway for gold was as follows:
- Initial surge up to $1,072
- 4% correction back to $1,026
- 19% advance up to $1,227
- 15% correction back to $1,044
From then, the resumption of the bull market continued, as gold rose to $1,920 by September 2011.
This series of events (a – d) as gold broke its multi-year all-time high is illustrated below:
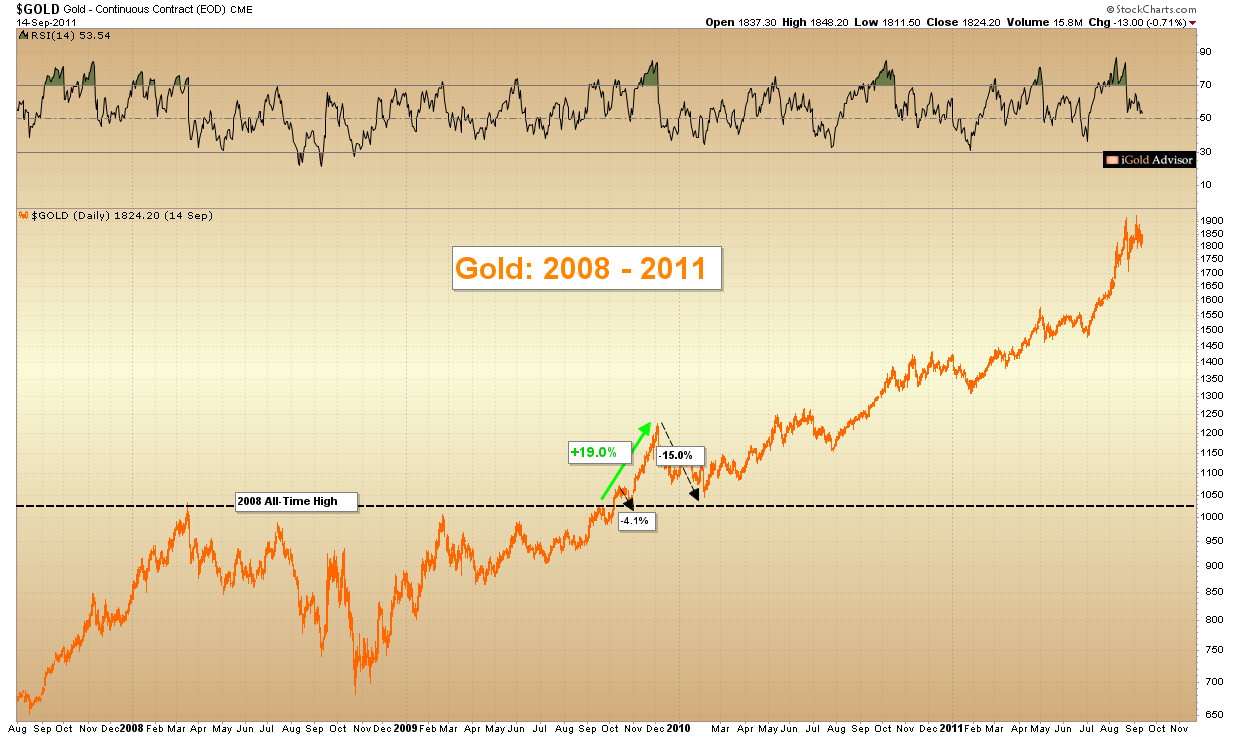
The critical takeaway?
Gold saw two corrections back down to its breakout point, before the bull market resumed in earnest.
The Pattern
Can we recognize a repeating pattern here amidst the only three times in history that gold has broken multi-year all-time highs?
Gold breakouts usually feature the following series of events:
- An initial advance à
- Followed by a correction back to the vicinity of the breakout point à
- Followed by a second larger advance à
- Followed by a second correction back to the vicinity of the breakout point à
- Followed by a resumption of the bull market.
We might ruminate and speculate for lifetimes as to why this pattern appears repeatedly in the gold market.
However, for our work here, we are content to observe that the pattern does repeat, and to attempt to profit from this knowledge.
Gold – Back to the Present
To reiterate: gold has just witnessed only its fourth multi-year all-time high breakout since free trading began in 1971.
This is a historically monumental moment not only for gold, but for the entire global monetary regime.
In future articles, we will discuss some of the reasons why the current gold breakout is happening. For now, let us highlight the expected path forward, based on the historical pattern.
On July 26, 2020, gold broke its former 2011 all-time high of $1,920 spot.
From there, the pathway forward has been:
- Initial surge up to $2,074 (COMPLETE)
- 10% correction back to $1,862 (COMPLETE)
What should occur next is as follows:
- Due next: 15% - 25% advance up to $2,280 - $2,400
- Followed by: 15% - 20% correction back down to $1,824 - $2,040
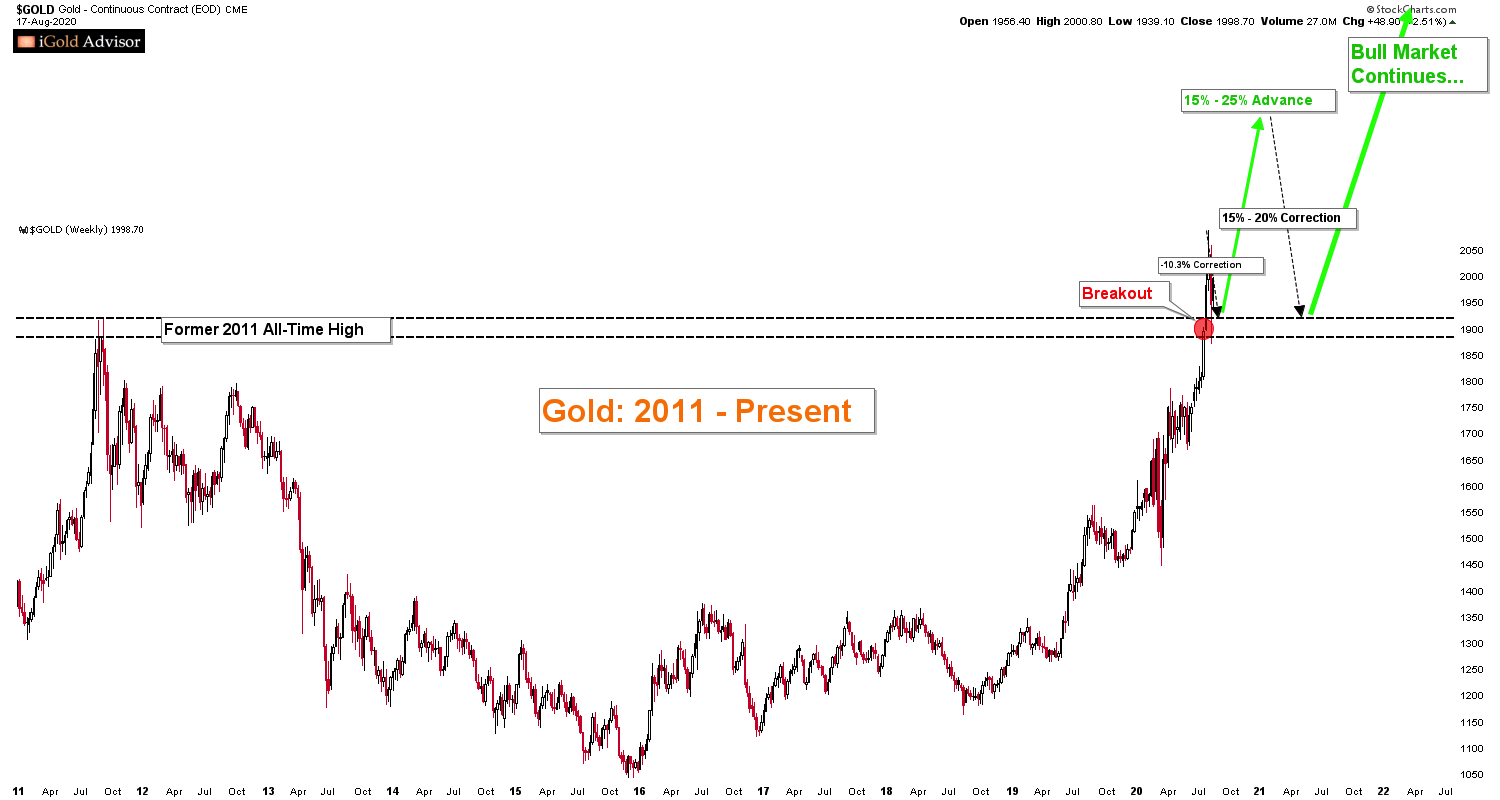
- Following the more severe correction which we expect to materialize later this year, a resumption of gold’s bull market should occur, with significantly higher targets above $2,400. Those higher targets will be revealed in future articles.
Takeaway on Gold Prices
This is the fourth multi-year all-time high breakout for gold since free trading began in 1971.
There is a clear price pattern which gold has followed on all past breakouts. Every hint that we observe thus far suggests that gold is set to follow a similar price trajectory this time.
At https://igoldadvisor.com we are intensely engaged in profiting from both the larger bull market now underway, and also the shorter-term price swings identified by the pattern above. Gold investors should be extremely careful not to chase prices higher once we begin to reach point (c) above, because a significant decline will be expected later this year. We will be recommending to our clients defensive strategies at that time.
However, the important point bears repeating: a major multi-year breakout is now underway for gold and the precious metals market. This is a rare moment in world monetary history. Do not miss it.

Christopher Aaron began his career as an intelligence analyst for the CIA and Department of Defense. He served two tours to Afghanistan and Iraq between 2006 - 2009, conducting pattern-of-life mapping for military leaders.
Mapping shares similarities with technical analysis of the financial markets because both involve the interpretation of repeating patterns found in human nature. He is the founder of iGold Advisor, providing independent research and analytics on all aspects of the precious metals markets.
He speaks regularly on the cyclical patterns found within the financial markets and on international policy. He has been featured in the New York Times and NPR news amongst other financial publications.


