Gold Price Forecast: All-Time Record High Volume – What Does It Mean


With the newsworthy events of the last few weeks including the assassination of Iranian general Soleimani, retaliatory missile attacks against US forces in Iraq, and now the coronavirus, gold has just broken all-time records for volume on the world’s futures exchanges. Clearly, gold is a market which is gaining interest and momentum at this very moment.
Yet what exactly does volume really tell us? Is all-time record high volume a good sign or a bad omen for the future of gold?
Let us examine these questions and more in this gold price update.
Gold Volume Shatters Records
Gold volume, or the number of ounces of gold which have changed hands during a given period, shattered both daily and weekly all-time records just two weeks ago in the aftermath of the Iran flare-up.
This is no exaggeration: more gold traded hands on the global futures market on January 8, 2020, the day of Iran’s retaliations, than on any other day in the history of record-keeping dating back to the abolishment of the Bretton Woods Accord in 1971: 79.6M ounces.
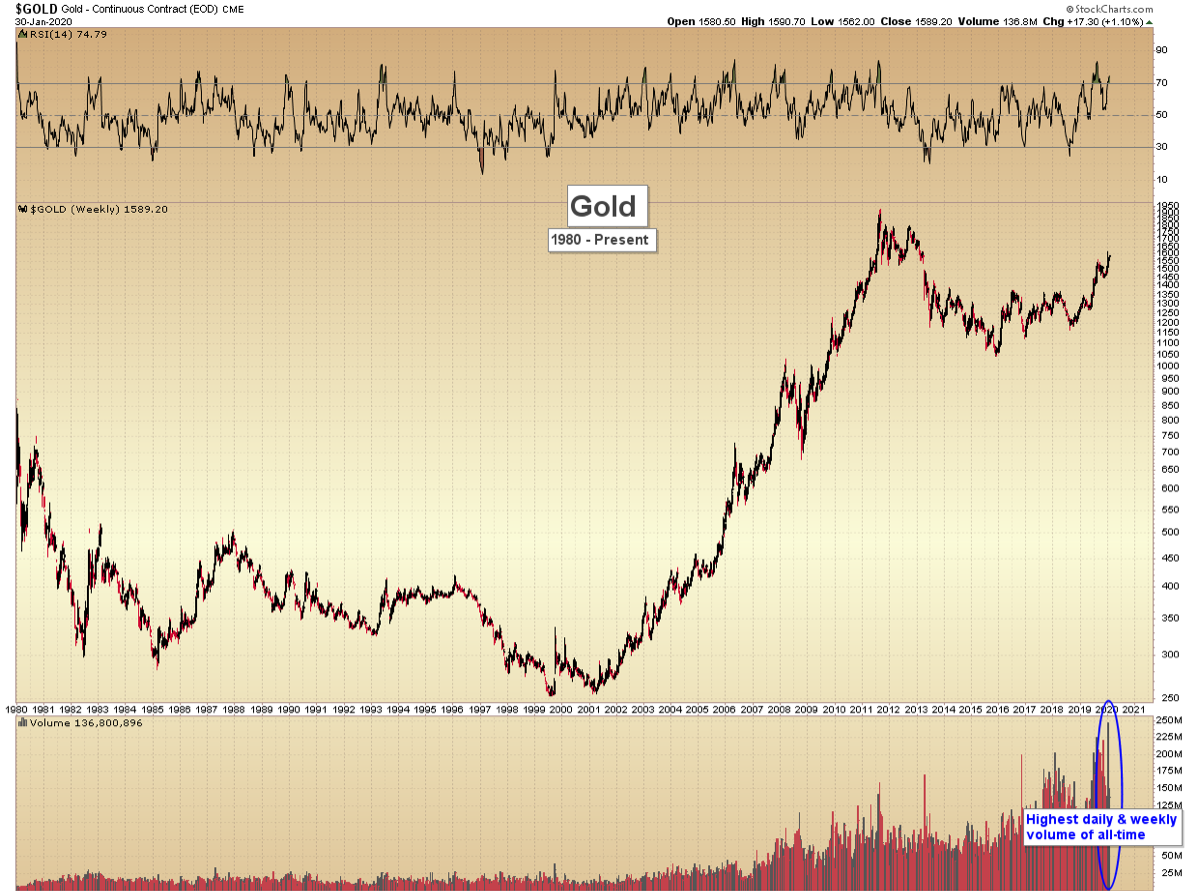
For the week ended January 10, a new all-time high of 246M oz was recorded, equal to 2.4M futures contracts.
What does this mean for us as investors?
Discussing Volume
Volume analysis must always be placed into context.
Did the historic trading day take place on a breakout above a previous resistance level? à If so, volume becomes a positive confirming indicator.
Did the record day occur on a breakdown below support? à If so, volume becomes a negative data point.
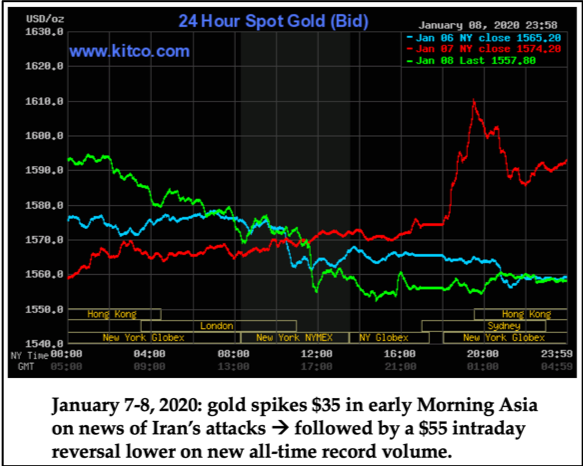
In the case of January 8, the highest amount of gold traded in recorded history occurred on a negative reversal day, following the missile attack by Iran against US forces in Iraq, and President Trump’s subsequent statements later that day that Iran was “standing down” from future military escalation.
Whether or not Trump’s statements prove to be correct will only be known in hindsight – and history will judge whether or not our President has made an accurate assessment of Iran’s intentions.
However, the gold market judged in its own language, by reversing $55 intraday on the highest volume in its freely-traded history.
This is a negative development. To state anything less would be to hide from the reality of the situation.
Negative Reversals from History
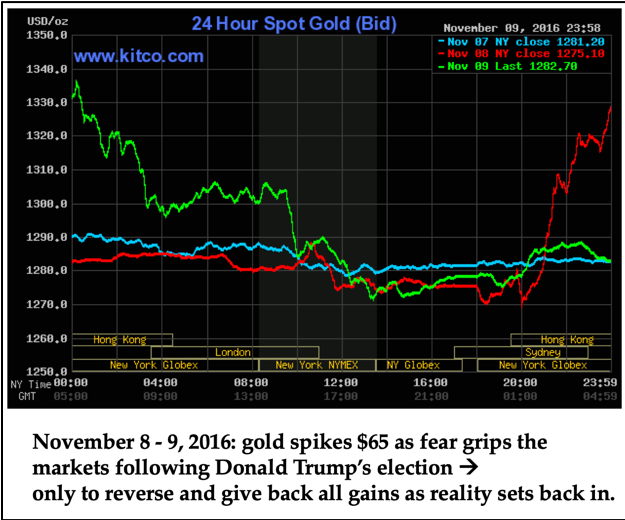
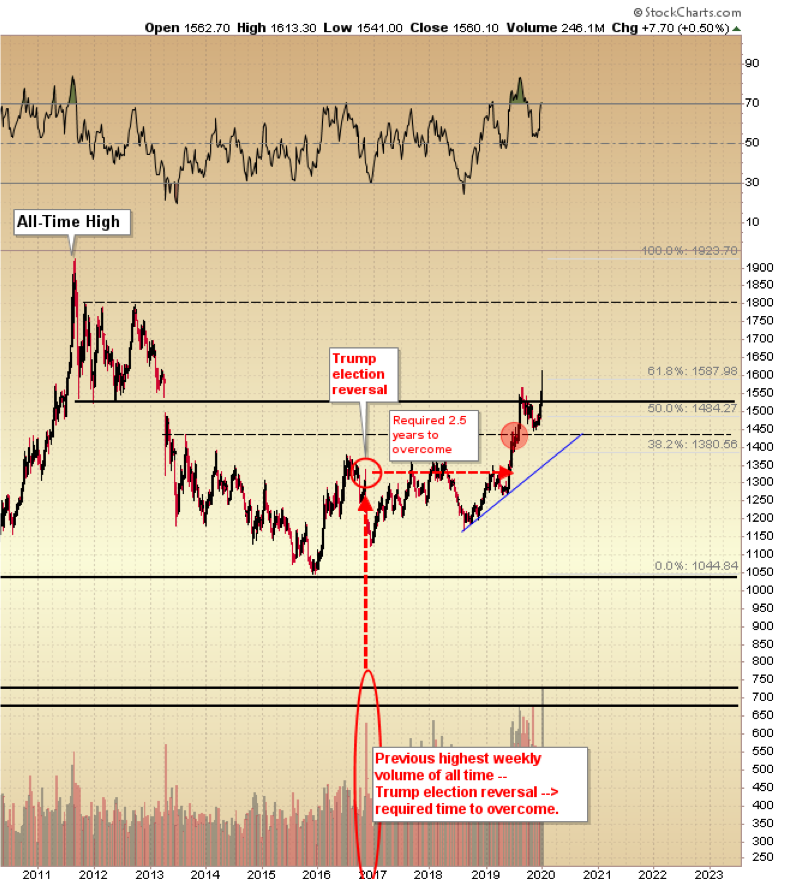
Let us examine the most recent time that gold shattered volume records for a negative reversal – it was not that far back in history: the date was November 9, 2016.
What day was this?
The day after Donald Trump was elected the 45th President of the United States.
Specifically, on the night of November 8 (November 9 in Asia), as exit-polls indicated Trump would pull off a previously unimaginable victory over Hillary Clinton, gold spiked $65 from $1,270 to $1,335 and the Dow Jones Industrial Average futures fell by 750 points, as market participants began to price in something akin to Armageddon due to the incoming rogue President.
However, the next day, as reality set in and investors realized that life would likely continue even with Trump as President, both the stock market and gold reversed their fear reactions. Fast forwarding… gold prices went on to lose $210 over the next six weeks, and the Dow began a historic run, rising 30% over the next year.
The most important point of this entire narrative?
Gold reversed on (at that point) its highest daily and weekly volumes of all time: 200.5M oz for the week, and 78.4M oz for the single day following Trump’s election. These numbers are just slightly below the new records printed this month.
What was the significance for gold of this high-volume reversal?
Notably, not the start of a long-term bear market; however, it did take gold over 2.5 years to successfully overcome and sustain the Trump reversal night peak of $1,335 (June 2019).
The price action surrounding the Trump election reversal on then-record volume, and the ensuing 2.5-year consolidation, is shown at right.
Back to the Present – Remember Context
Again, the idea of context being key comes to the forefront.
Gold’s new all-time high trading volume, achieved this past week, has occurred after a successful breakout from a 6-year base above $1,434.
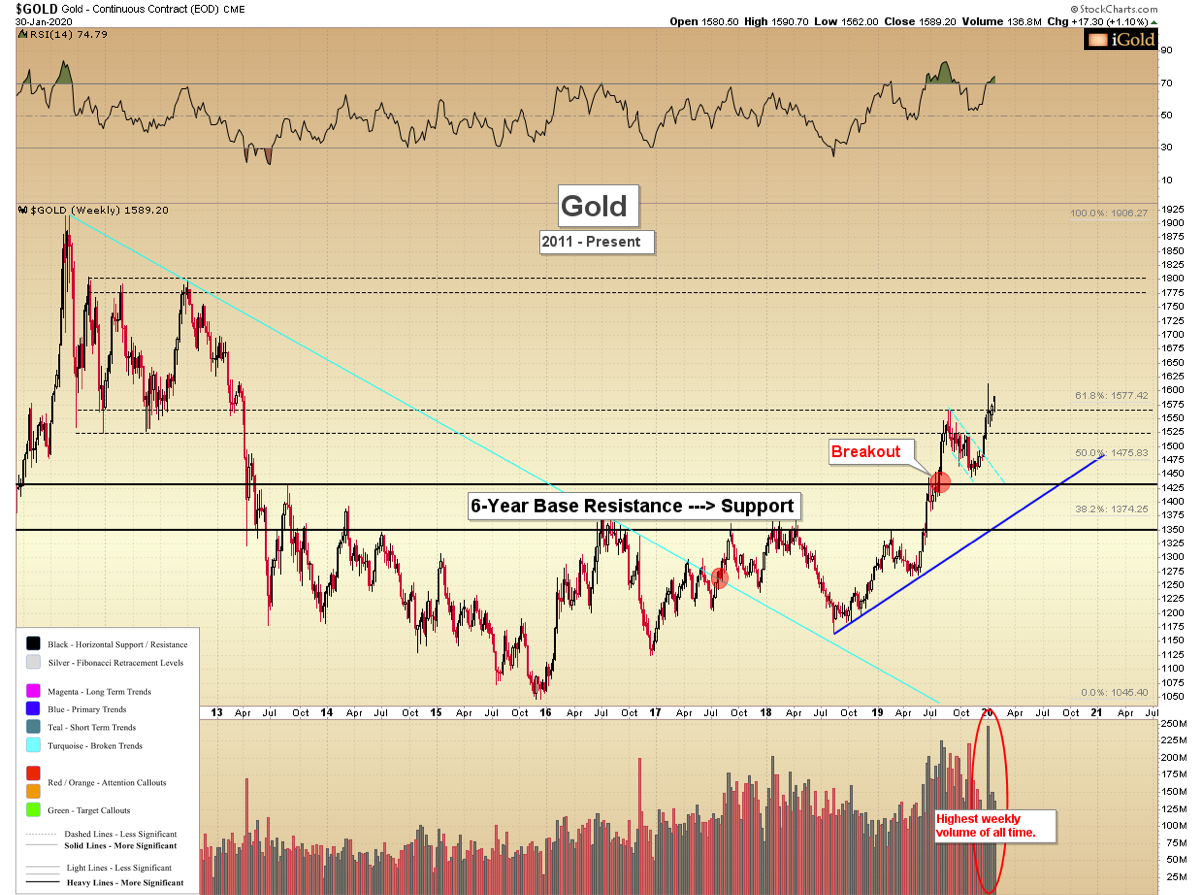
We maintain independently-derived higher targets for gold in US dollar terms ($1,711 - $1,823), based on amplitude measurements of the preceding 6-year base.
However, new information has been obtained in the previous two weeks which we did not have previously. Specifically, we have seen a negative reversal day following the Iran attacks, on the new record-breaking highest volume of all time.
Does this mean that gold must now top, or consolidate for another 2.5 years before overcoming $1,613, the peak from the overnight session on January 8?
Not necessarily.
Gold is still in a breakout scenario with higher targets.
That said, the high-volume reversal strongly suggests that a period of consolidation lasting several months at minimum will now be required for gold to make its next attempt at advancing.
Either that – or an even higher influx in volume would need to accompany the next surge attempt. Enough volume to displace all those 2.4M contract holders from January 8 who are now underwater on their purchases, and who will be looking at the next rally to sell their gold near break-even.
It is this “sell at break-even” mentality which causes high-volume reversals to be so challenging to overcome.
Gold Prices Short-Term
Let us place this all into perspective with the near-term look:
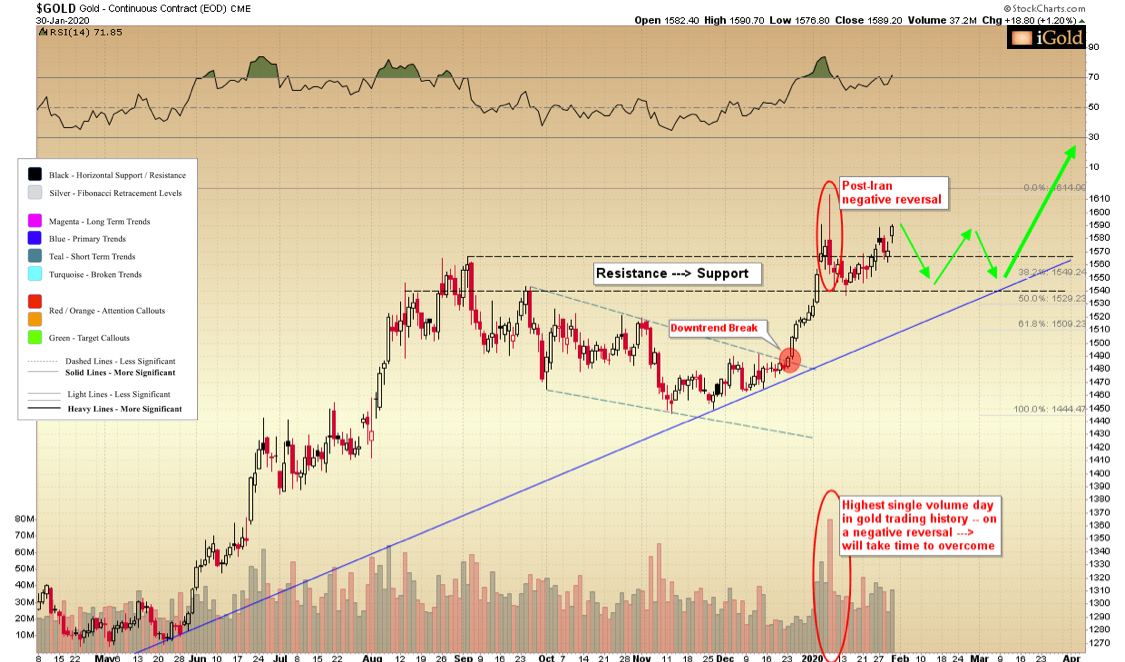
A war is the only scenario we can imagine which would cause a new-record volume spike to immediately displace all those underwater contract holders from January 8.
The more likely scenario, shown in green, is favored, in which gold need not necessarily decline significantly further in percentage terms, but instead will need time to consolidate above recent lows. Through a process of “chipping away” at the overhang of sellers who represent former buyers from January 8, metal will be moved from weak hands to strong hands, to setup for the next advance.
The specifics:
- Minor support exists down to $1,541, representing former peaks from August / September 2019, and the intraday low on January 9 (lower black dashed line).
- Stronger support exists at $1,500 and rising, a figure which represents (blue) trend buyers from the May à November bottoms.
- Strong resistance exists up through and including the reversal spike at $1,613.
Takeaway on Gold
Gold witnessed a negative reversal following Iran’s attacks. This reversal featured the highest daily and weekly volumes ever recorded.
This reversal must be placed into context: it occurred six months following a breakout in gold above a 6-year base resistance zone.
Barring a new stronger surge in volume, which we suspect could only occur amidst outright war with Iran, gold will need time to consolidate its recent gains. Likely following several months for consolidation above support, we maintain higher targets for gold later in the year.
********

Christopher Aaron began his career as an intelligence analyst for the CIA and Department of Defense. He served two tours to Afghanistan and Iraq between 2006 - 2009, conducting pattern-of-life mapping for military leaders.
Mapping shares similarities with technical analysis of the financial markets because both involve the interpretation of repeating patterns found in human nature. He is the founder of iGold Advisor, providing independent research and analytics on all aspects of the precious metals markets.
He speaks regularly on the cyclical patterns found within the financial markets and on international policy. He has been featured in the New York Times and NPR news amongst other financial publications.


