Gold Price Forecast: Cycles Confirm Key Turn


 Recap of Last week
Last week's trading saw gold forming its high in Monday's session, here doing so with the tag of the 1994.80 figure. From there, a sharp decline was seen into Wednesday's fed day, with the metal dropping all the way down to a low of 1895.20 - before bouncing off the same into later in the week.
Gold Market, Short-Term
For the near-term action, the downward phase of the 10-day cycle has been seen as in force over the past week, with that cycle shown again on the chart below:

In terms of price, the downward phase of this 10-day wave was confirmed by the March 11th reversal below the 1962.40 figure (April, 2022 contract). With that, prices dropped some 67 points on through that level, before seeing a low registered last Wednesday. For the bigger swing overall, however, gold was down some 183 points from the March 8th peak.
For the very short-term, it looks like our 10-day cycle may have bottomed on Wednesday, which would be confirmed by any reversal above the 1952.00 figure (April, 2022 contract). If seen, the path would favor additional strength through the same, with the 10-day moving average acting as the normal minimum magnet to the upward phase of this component - a move which is now favored to end up as a countertrend affair.
Gold Market, 3-6 Week Picture
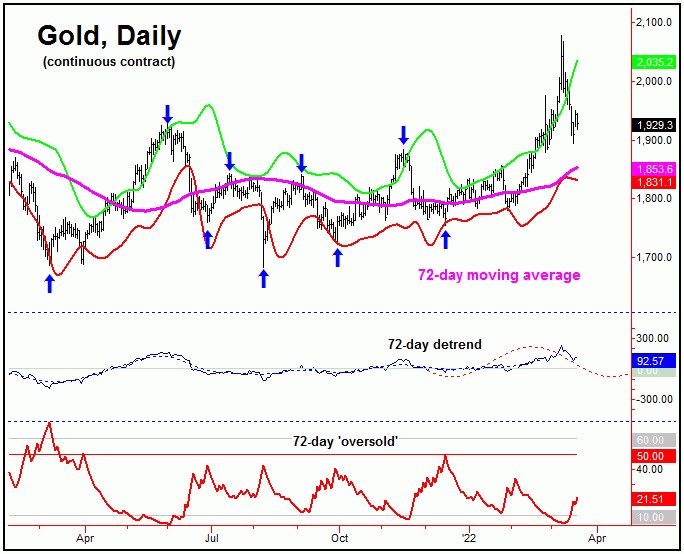
Stepping back, as noted in past articles, we knew that the next peak of significance was due to materialize, and coming from the larger - and extended - 72-day cycle. With the action seen last week, the downward phase of this wave is now confirmed to be in force. Here again is that 72-day component:
With the above said and noted, the 72-day cycle topped out at the 2078.80 swing high - and thus is now heading south into what looks to be the early-April timeframe, plus or minus. If correct, this tells us to expect the upward phase of the smaller 10-day cycle to end up as a countertrend affair, holding at or well below that 2078.80 peak.
Resistance to any swing up looks to be the 1986-2008 region for gold, which is the 50-61% retracement of the swing down from the 2078 high to the 1895 low. In other words, we should see the 10-day moving average acting as the upside magnet in the coming days, but with key resistance to the swing at or into the 1986-2008 region.
Going further with the above, a countertrend rally with the 10-day cycle means one that remains below the 2078 swing top, with resistance as noted. If the move does end up as the anticipated countertrend affair, we should see a drop back to lower lows for the swing into early-to-mid April, where we will need to be on the lookout for key indications of the next 72-day trough forming.
Going further with the above, in terms of price, our ideal path is looking for a drop back to the 72-day moving average and/or the lower 72-day cycle band into the next 72-day trough, with that zone (currently the 1831-1853 region) also acting as a support zone to this correction.
From my 2/13/22 article: "Something that I will be watching in the days ahead is whether gold is able to close back above its upper 72-day cycle band. If the same is seen while the lower 72-day 'oversold' indicator spikes back above its upper reference line (i.e., both on the same trading day), then that will be the recipe to pick a top with this 72-day wave."
As mentioned back in mid-to-late February, a close above our upper 72-day cycle band - along with a drop back below the 72-day 'oversold' indicator (which moves inversely to price) - was something we should expect to see near peaks for this 72-day wave. This setup did occur earlier this month, coming just a few days from the 2078 swing top - the high for the bigger move up.
Stepping back then, we will be watching the exact inverse of the above pattern in the coming weeks. In other words, if we see gold spiking down for a close below our lower 72-day cycle band, and - on the same day - we were to see a spike above our 72-day 'oversold' reference line, this will be the recipe for the next key low to form, expected to come from this same 72-day component. Stay tuned.
Jim Curry
The Gold Wave Trader
http://goldwavetrader.com/
http://cyclewave.homestead.com/
*********
More from Gold-Eagle


