Gold Price Forecast: Gold 2200 May Come Sooner Than You Think


Last week's trading saw gold forming its low in Monday's session, here doing so with the tag of the 1767.20 figure. From there, a sharp rally was seen into late-week, with the metal running all the way up to a Friday peak of 1852.70 - before backing slightly off the same into the daily/weekly close.
Gold, Short-Term
As pointed out in my prior article from last weekend, gold was at or into short-term bottoming territory, with that low expected to come from the combination of the 10 and 20-day cycles:
From my 11/29/20 article: "Once the next 10 and 20-day cycle low is set in place, then the odds will favor a rally back to the 20-day moving average or better into what is projected to be the first week or so of December. In terms of patterns, due to the configuration of the larger 72 and 154-day cycles, that move is currently anticipated to end up as a countertrend affair - with resistance at or near the upper 20-day cycle band."
With the above said and noted, gold promptly bottomed the 10 and 20-day cycles last Monday, and then shot right up to our 20-day moving average target with the action seen into late-week. Here again is our 20-day cycle chart:
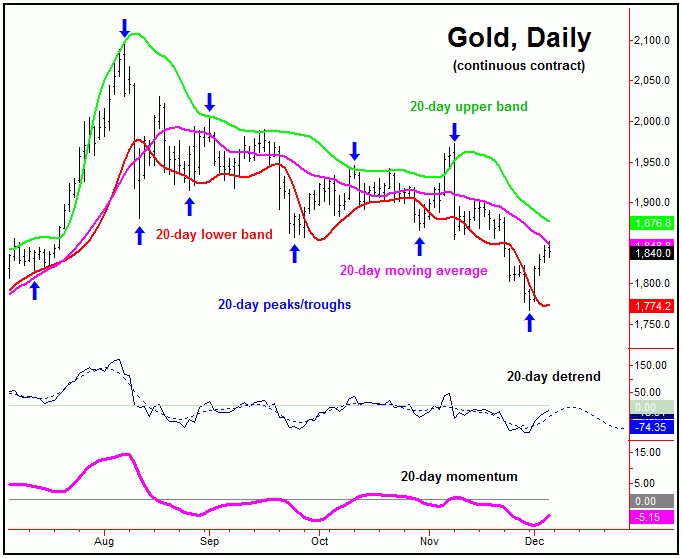
On the chart above, we can see the sharp 'snap-back' rally to the 20-day moving average. This action follows my rule, which is this: a statistically valid cycle will revert back to a moving average of the same length, approximately 85-90% of the time on either an upward (i.e., rally) or downward (i.e., correction) phase.
In terms of patterns, until proven otherwise the move up is expected to end up as a countertrend affair, against the larger downward phasing of the 72 and 154-day cycles - the combination of which are projected to bottom later this month.
For the very short-term, however, even with our minimum 20-day moving average magnet having been met, there is the potential for additional strength in the coming days. That is due to the fact that a tag of the upper 20-day cycle band will also normally be seen during the upward phase of the 20-day wave. On this 20-day chart, you can see our upper cycle band to be the 1876 figure (and declining).
With that, our ideal path for the near-term favors the strength seen into last week holding up for additional rally into the new trading week, then to be on the technical lookout for the next short-term peak to form. In terms of time, we have a key 'reversal date', one that appears to be the odds-on favorite to peak the move up - with exact details noted in our thrice-weekly Gold Wave Trader market report.
Gold's Mid-Term View
For the mid-term picture, the larger 72-day and 154-day cycles are seen as pushing south into later this month, before forming the next larger-degree bottom for gold. Shown below is the smaller 72-day cycle component:
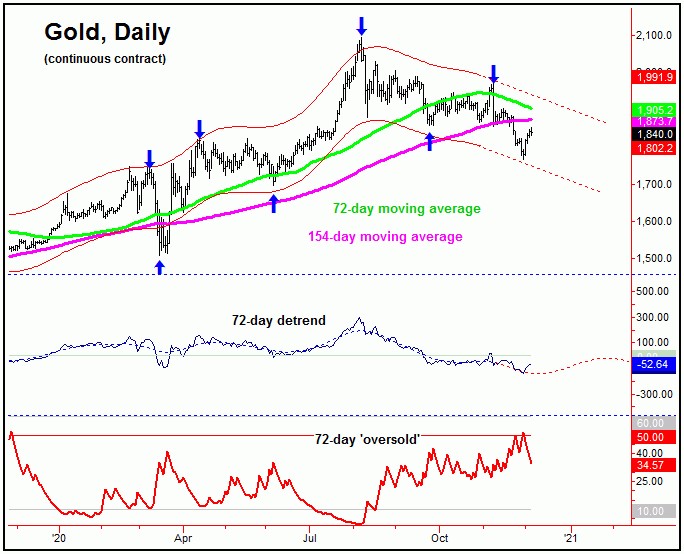
From the comments made in recent articles, the overall assumption has been that the bigger bull market was still intact for gold - and that the decline that began with the early-August peak would end up as a larger countertrend affair. That decline is expected to bottom with the combination of 72 and 154-day cycles.
Key to note on this 72-day cycle chart is that its next trough is coming due, having been projected for later this month.
The second thing of mention - and perhaps more key - is that our 72-day 'oversold' indicator has recently spiked back above its upper reference line. This is something that is normally seen at or near bottoms with this particular wave. Note that this indicator moves inverse to price action - similar to how the VIX acts, in its relationship to the U.S. stock market.
With the above said and noted, either our 72-day trough is already in place, or else the next drop back to lower lows would be solidly favored to bottom this wave. Take a look at our next chart, which shows the larger 154-day component:
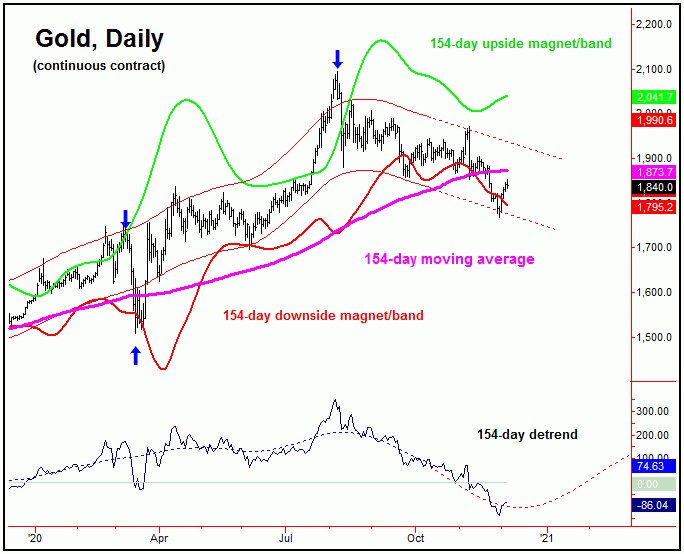
With the chart above, we can see that our 154-day wave is also at or into bottoming territory, though the 'ideal' trough for this cycle would be made into later this month. As mentioned in a prior article for Gold-Eagle, the downside 'risk' for the metal was to the mid-1700's - which we have obviously seen with the recent action.
In terms of price, the minimum upside potential - once this 154-day wave turns higher - is back to the upper 154-day cycle band, currently at the 2041 figure - but which is also rising daily.
Having said the above, in my prior articles, the upside potential was noted to the 2212.00 - 2340.56 region for gold, which is our open upside target from the largest cycle that we track - the nominal four-year component:
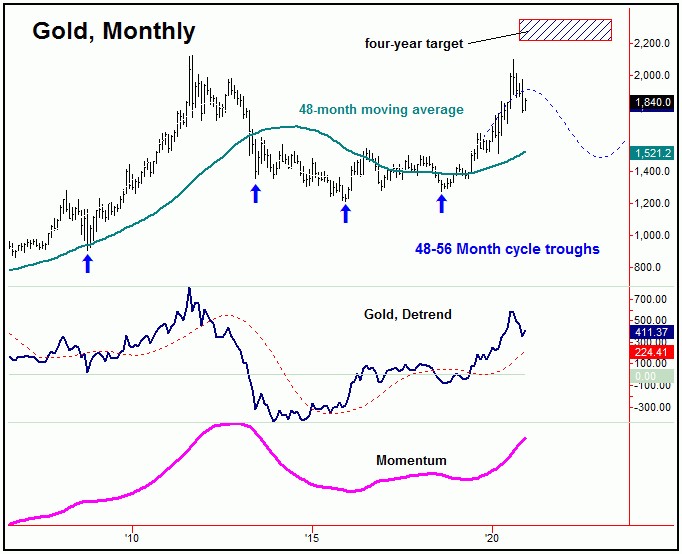
With the above chart, we can clearly see our open four-year target, with both momentum and our detrend indicators still moving higher - thus keeping the upward phase of this cycle firmly intact.
Gold 2200 May Come Sooner Than You Think
With the configuration of each of the 72-day and 154-day cycles - which are at or into bottoming range - Gold 2200 may come sooner than you think. That is, the larger swing down has either already bottomed, or else has a marginally lower low to go before doing so. Will you be prepared for the next upturn?
Jim Curry
The Gold Wave Trader
http://goldwavetrader.com/
http://cyclewave.homestead.com/


