Gold Price Forecast: Key Support and Resistance Levels


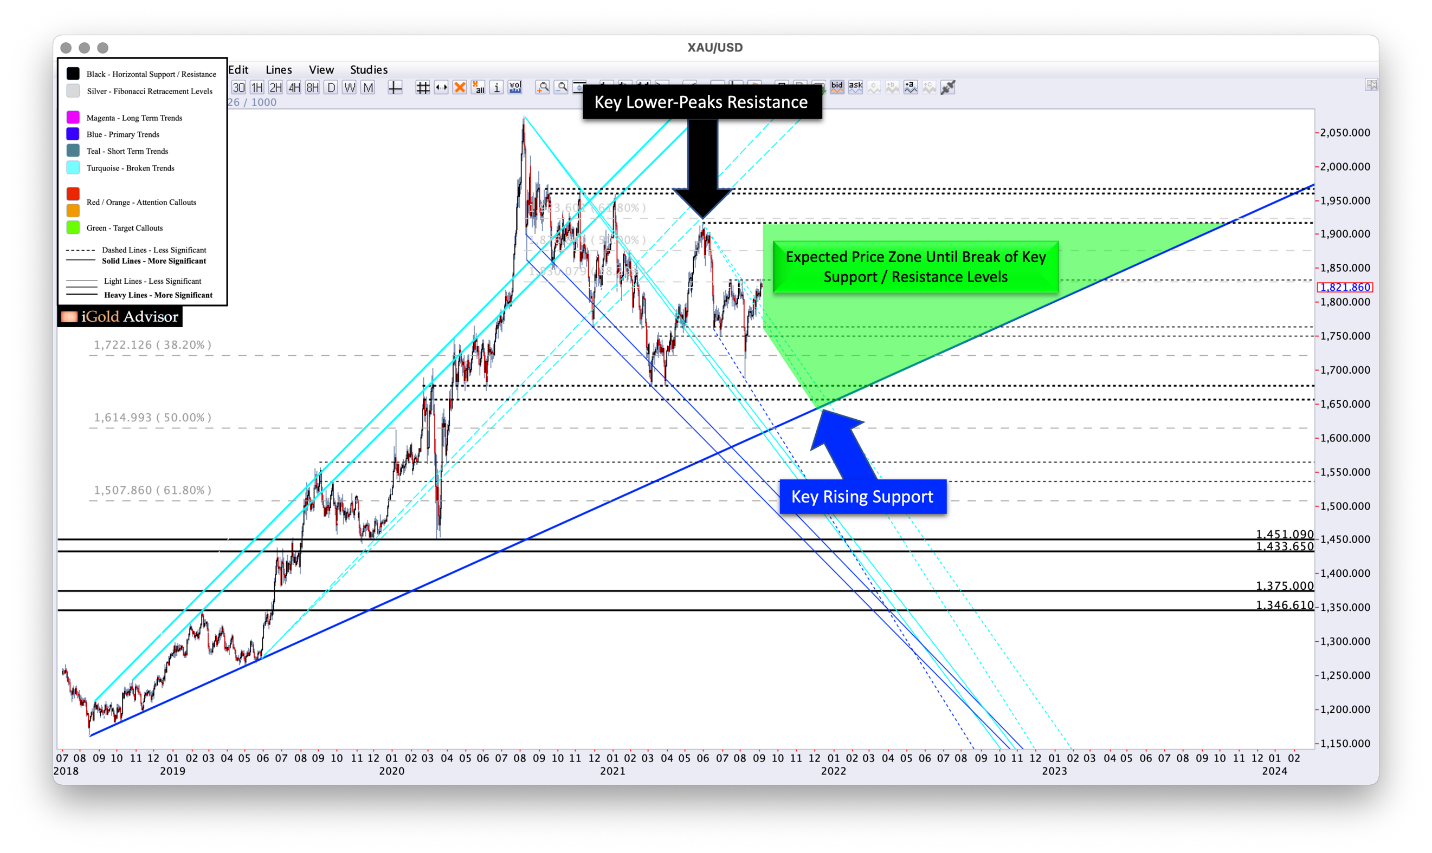
Gold is trading within a giant consolidation pattern. We will look for clues as per which direction the consolidation will eventually resolve based on two key trigger levels: a break above $1,917 would signal a continuation of the 2015 – 2020 bull market, whereas a failure at $1,610 would mean a multi-year bear market is still looming. What our analysis thus shows is that gold should be expected to trade within a nearly $300 range for the foreseeable future, with a much larger move pending within 12 – 18 months.
Let us examine the relevant resistance and support levels for more detail on the range of outcomes:
Gold’s Key Resistance
The key to gold resuming a bull trend will come from a break above the May 2021 peak at $1,917 per ounce (black callout).
Why is this figure so important?
Because it represents the latest in a string of lower and lower peaks which have formed since the 2020 top gold price of $2,074 per ounce. Every several months since then, gold has witnessed sellers emerging at lower and lower intervals.
The key to gold breaking its string of lower peaks will thus come from a price print above $1,917 in the spot market. Even an intraday peak above this figure will demonstrate a weakening of this persistent selling resolve.
Expectations on a Breakout
It is important to remember that even an initial print above $1,917 does not mean gold must necessarily skyrocket immediately. No, instead as we can see from the green shaded price expectation zone, gold could still soften back into the support zone for some months following.
However, a price above $1,917 will be an important data point in showing us that the series of lower peaks since the 2020 high has finally been broken.
Following a breaking of a downward series of peaks, while temporary softness may still occur, we would expect to see a new series of higher peaks begin to emerge. And it will not take too many higher peaks for gold to reach a new all-time high above $2,074 per ounce.
$1,917 is thus the key resistance level which must be broken to begin to establish the long-term bullish case.
Gold’s Key Support
Conversely, gold’s key zone of buying interest now comes in at $1,610 (blue callout). This trend of buyers began to emerge in August 2018, at the major low near $1,180 per ounce. From that point onward, we have witnessed higher and higher lows emerging, until gold began to accelerate away from the trend toward the 2020 all-time high at $2,074.
Although it may be tempting to forget about the old (blue) trend of rising buyers, our historical analysis shows that to do so would be unwise. Trends are considered valid until proven otherwise in technical analysis. Gold’s rising trend of buying support, which began in 2018, should now be expected to emerge at $1,610 – and we are willing to wager that buyers will indeed show up at that price level should gold fall that far in the future.
Note that gold does not necessarily need to fall back to the low $1,600’s to see those buyers emerge. Rising trends indeed feature price support which increases throughout time. So in this case, gold could simply consolidate sideways between $1,700 - $1,850 for the next 12 months, and the same trend would begin to exert buying pressure influence near current prices.
Expectations on a Breakdown
A break of this multi-year rising trend would be an ominous signal for gold into the mid-2020’s. Such would show that gold would not be expected to break its 2020 peak of $2,074 per ounce until at least 2025. We do not want to predict such an outcome at this juncture, because a trend must be considered valid until proven otherwise. Still, the support level, currently at $1,610 and rising each week, should be carefully monitored by all gold investors for the impact it will have on the future of gold into the middle part of the decade.
Takeaway on Gold Prices
The key resistance figure for gold comes in at $1,917, matching the May 2021 peak, while the key support figure for gold comes in at $1,610 and rising, representing a trend of buying interest which began in 2018.
We remain agnostic regarding gold prices themselves until one of these key figures is broken. Until then, we expect a nearly $300 trading range to develop between the key figures, lasting perhaps into mid-2023.
We will be evaluating silver, the US dollar, and the gold mining sector in future updates to gain further clues as to gold’s eventual outcome.
Buyers should be positioning themselves on weakness over the months ahead, while watching for the key support levels to hold if and when they are eventually tested.
*********

Christopher Aaron began his career as an intelligence analyst for the CIA and Department of Defense. He served two tours to Afghanistan and Iraq between 2006 - 2009, conducting pattern-of-life mapping for military leaders.
Mapping shares similarities with technical analysis of the financial markets because both involve the interpretation of repeating patterns found in human nature. He is the founder of iGold Advisor, providing independent research and analytics on all aspects of the precious metals markets.
He speaks regularly on the cyclical patterns found within the financial markets and on international policy. He has been featured in the New York Times and NPR news amongst other financial publications.


