Gold Price Forecast: Up Into Mid-January, US Stocks Bracing For Decline


 Last week's trading saw gold prices running all the way up to a new high for the bigger swing, with the metal forming its peak in Wednesday's (overnight) session, doing so with the tag of the 1613.30 figure. From there, a sharp retracement was seen into later in the week, here dropping back down to a Thursday low of 1541.00 - before bouncing off the same into late-day Friday.
Gold Market, Short-Term
For the very short-term, the smallest cycle that we track is the 10-day wave, which is shown on the chart below:
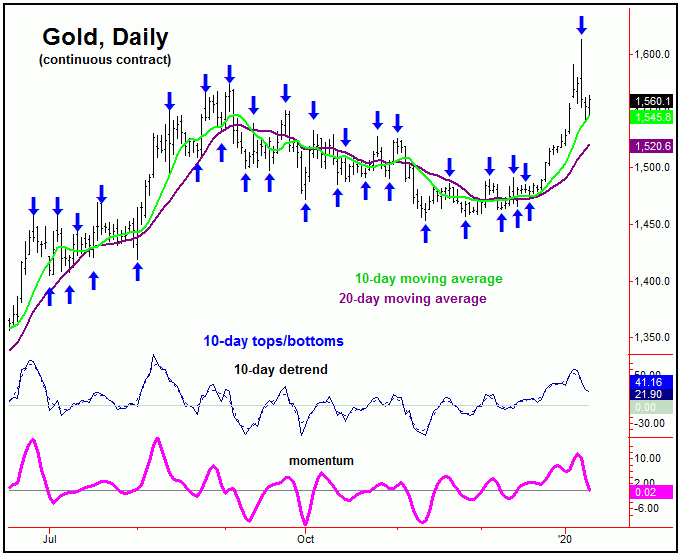
In terms of price, in our Gold Wave Trader market report we noted that the trough for this 10-day wave was due around the January 8-9 timeframe - and with that a sharp retracement was due to materialize. In terms of price, our call was for an expected decline back to the 10-day moving average - simply based upon my rule with moving averages, and the fact that this wave will revert back to this key moving average at approximately 85-90% of the time.
With the above said and noted, Thursday's decline took gold right down to its 10-day moving average (1541) - thus meeting our bare-minimum expectation for the downward phase of this 10-day cycle. With the decline stopping there - and with this wave having been projected to trough into the January 8-9 timeframe - it may well have bottomed on Thursday, though it is too early to actually confirm.
In terms of patterns, however, the correction phase of the 10-day cycle was favored to end up as a countertrend affair. For some speculation, if the 10-day wave did trough on Thursday, then the probabilities would favor another try at the recent highs into the next projected peak for this wave, which is due in the next week or so. From that high, we would be looking for another decent decline phase into later this month.
Gold's 72-Day Cycle
Stepping back, the next peak of importance has been expected to come from the 72-day cycle, with this wave last bottoming back in December - and confirmed with the following reversal above the 1490.00 figure (February, 2020 contract). Since that reversal, the metal has risen over $123 into its most recent high. In terms of time, the rally phase of this wave has been projected to hold up into the mid-January timeframe or later. Here again is our 72-day wave:
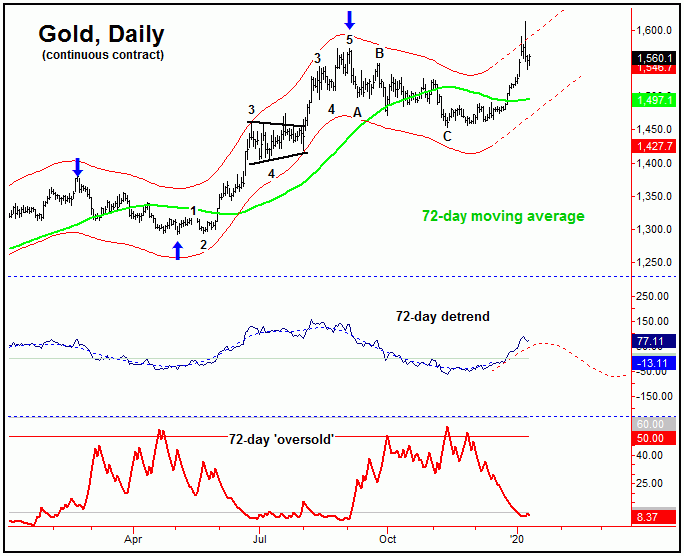
Based upon the overall action from momentum, there is at least some potential that the peak for the larger 72-day cycle was actually made with the recent tag of the 1613.00 figure. I say that due to the fact that spike up to this figure was made in the overnight session on Wednesday - and also due to the subsequent selling off the same. Having said that, this is speculation - at best - and it is too early to actually confirm.
Going further with the above, it is also too early to confirm a new downside ‘reversal point’ for this wave - though we expect one to show up in the days/weeks ahead. Stepping back, once this 72-day cycle does top out, gold has another date with its 72-day moving average.
For the bigger picture, we were looking for the current upward phase of this 72-day cycle to end up as countertrend - holding below the early-September, 2018 peak of 1573.00. Having said that, the recent break above this key figure says that the upward phase of our larger 310-day cycle has to still be in force - and thus did not peak back in September, as originally thought. With that, it should be favored to top with the current upward phase of the 72-day cycle. Once complete, the probabilities will still favor a decent correction into early-Spring, where the larger 310-day cycle is next projected to trough:
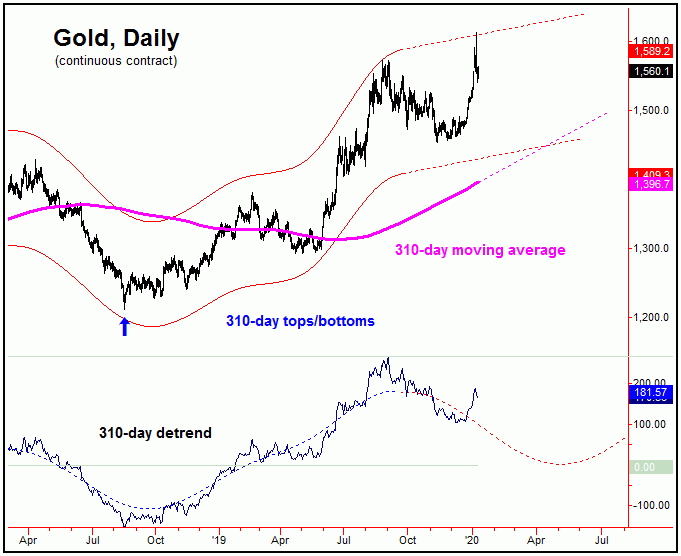
Adding to the notes above, we are still favoring the next downward phase of this 310-day cycle - if and when seen - to end up as a larger countertrend affair, to be followed by a continuance of the larger rally into later this year. From there, we will be on the lookout for the next major top for the gold market.

U.S. Stocks Topping
In recent weeks, I noted that both gold - and U.S. stocks - were headed higher into the current month of January. Unlike gold, the stock market is now very extended - and thus is due for what could be a very sharp correction in the days/weeks ahead. If seen, this would be simply an adjustment in momentum and sentiment, and thus would be viewed as only a temporary affair, with the larger bull market expected to remain intact well into the Spring of this year or beyond. Take a look:
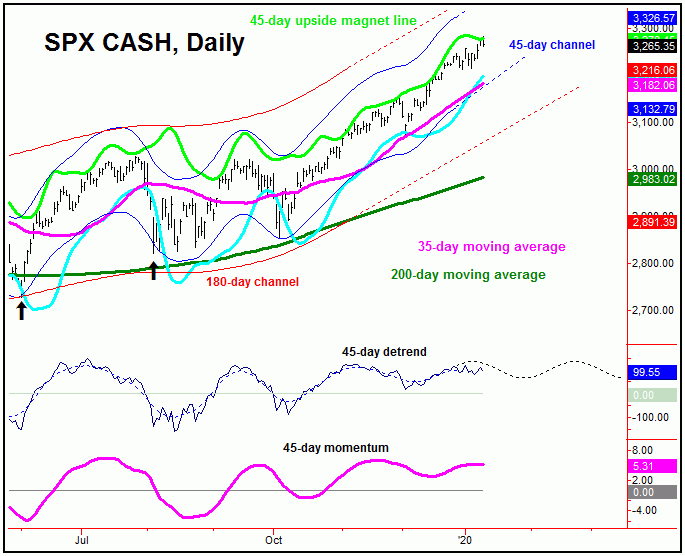
The above chart shows one of the most dominant cycles in the U.S. stock market, the 45-day wave. With this chart, the detrend is projecting lower prices in the days/weeks ahead, an assessment which is confirmed by momentum - which is also rolling over. With that, the minimum downside 'risk' is back to the 35-day moving average, though we see more downside potential than this bare-minimum decline.
Having said the above, with the 180-day cycle channel moving higher - as well as with the 200-day moving average trending up - we are expecting any sharp decline in the coming weeks to end up as an eventual countertrend affair, to be followed by higher highs on the next upward phase. From there, we will be on the lookout for the next mid-term top in stocks, which we think is coming.
The bottom line above is that gold's 72-day cycle has been projected higher into the mid-January timeframe, then to be on the lookout for technical indications of a peak. By the same token, U.S. stocks are very extended at the present time - and are looking for a sharp retracement in the days/weeks ahead, though each of the above moves are expected to end up as countertrend. Stay tuned.
Jim Curry
The Gold Wave Trader
http://goldwavetrader.com/
http://cyclewave.homestead.com/


