Gold Price Forecast into Mid-Term Bottoming Range
 share
share
 share
share
 share
share
 share
share
 share
share
 Last week's trading saw gold forming its high in Monday's session, here doing so with the tag of the 1734.80 figure. From there, a sharp decline was seen into later in the week, with the metal dropping all the way down to a Wednesday low of 1677.30 - before bouncing off the same into the weekly close.
Gold, Short-Term
For the very short-term, as mentioned last weekend the next smaller-degree rally phase was due to materialize at anytime, with that rally coming from the 10-day cycle:

In terms of price, we noted in our Gold Wave Trader report that the upside ‘reversal point’ for this 10-day wave had dropped to the 1717.00 figure (June, 2021 contract). And - when these reversal levels are taken out (in this case to the upside) - the probabilities are better than 90% that the cycle itself has turned. With that, taking this figure out to the upside on Thursday confirms a turn with not only this wave, but with the larger 20-day cycle.
With the above said and noted, the probabilities should favor additional strength in the days ahead, with the bigger question being whether the current upward phase of the 10 and 20-day cycles is going to be able to confirm a turn with our larger 72-day wave, shown again on the chart below:
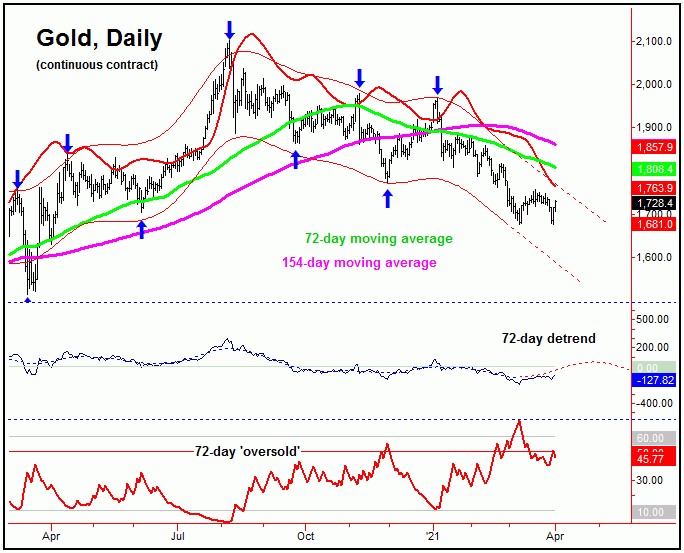
As mentioned in my prior article, this 72-day wave may well have bottomed with the March 8th tag of the 1675.50 figure - though this has yet to be confirmed, with the exact upside price reversal level noted in our Gold Wave Trader report.
Having said the above, the position of our 72-day detrend indicator - and its forward projected path - seems to be a decent indication that this wave has turned back to the upside. However, the ultimate confirmation has yet to be seen, and we are keeping a close eye on this as we head into the new trading week.
If and when the 72-day cycle should confirm its turn higher, we should see a pretty decent short-term rally for gold, though, until proven otherwise, that move is favored to end up as a countertrend affair - with resistance into the low-to-mid 1800's.
Gold's Mid-Term View
For the mid-term picture, the next low of significance is expected to come from the combination of 154 and 310-day cycles, with the same currently projected for the mid-May timeframe. Having said that, due to the larger plus or minus variance with these waves, there is at least the potential this bottom could be made earlier than expected - or it could come slightly later. Here again is our 310-day wave:
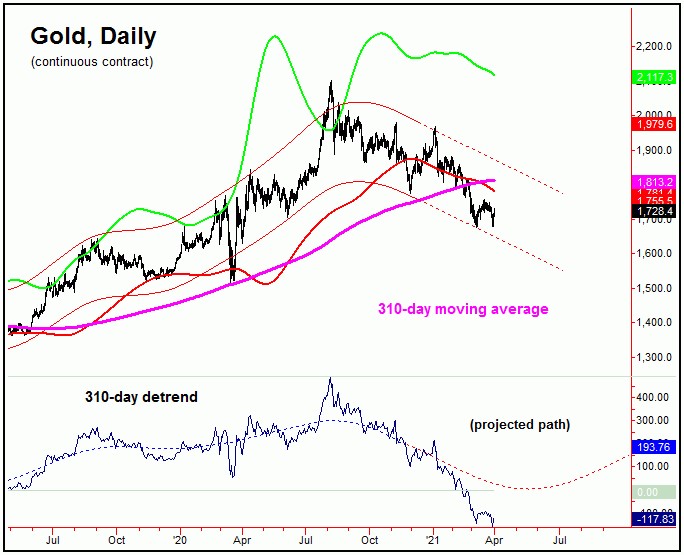
Of key note with the above chart is that our 310-day moving average is still trending to the upside, which means that the cycles above this 310-day wave (i.e., the 4 and 8 year cycles) are still pointing up. If correct, we should see a very sharp rally in the coming months, once this 310-day wave actually confirms its turn.
In terms of price, we now have a new upside ‘reversal point’ for our 310-day cycle, which is a daily close back above the 1885.00 figure (June, 2021 contract). Though this number is obviously well above current price levels, the good news is that it should start to drop sharply in the days/weeks ahead, depending on the action.
The Bottom Line
The overall bottom line is that the smallest cycles have recently confirmed a turn higher for the metal, which should favor additional short-term strength. Until proven otherwise, however, that strength is favored to end up as countertrend, giving way to lower lows into later this Spring - before the next mid-term bottom attempts to form. That bottom is expected to come from the larger 154 and 310-day cycles, which will be responsible for the largest percentage rally of this year in the months to follow.
Jim Curry
The Gold Wave Trader
http://goldwavetrader.com/
http://cyclewave.homestead.com/
********
share
share
share
share
share


