Gold Price Forecast: Next Surge To Follow US Election


Gold prices continue to correct from the new all-time high set on August 6, 2020. On that date, gold hit $2,074 per ounce – the highest cost to purchase one ounce of gold in the history of mankind. Since that point, gold has corrected some $226 or 10.9% to the recent low of $1,848 on September 28.
What is next for the price of gold? Has this been a major long-term top, or is there more upside to come?
Our analysis suggests the later – that gold is about to embark on a major new up-leg which should take it well above the recent $2,074 high.
Further, the timing of this next advance may be sooner than most people expect… perhaps as soon as weeks following the US election on November 3.
The time to prepare for this investment scenario is now.
Gold is Retesting Its Former All-Time High
It is critical that investors grasp the big picture for gold: the 5,000-year store of wealth is presently retesting its former 2011 all-time high resistance zone:
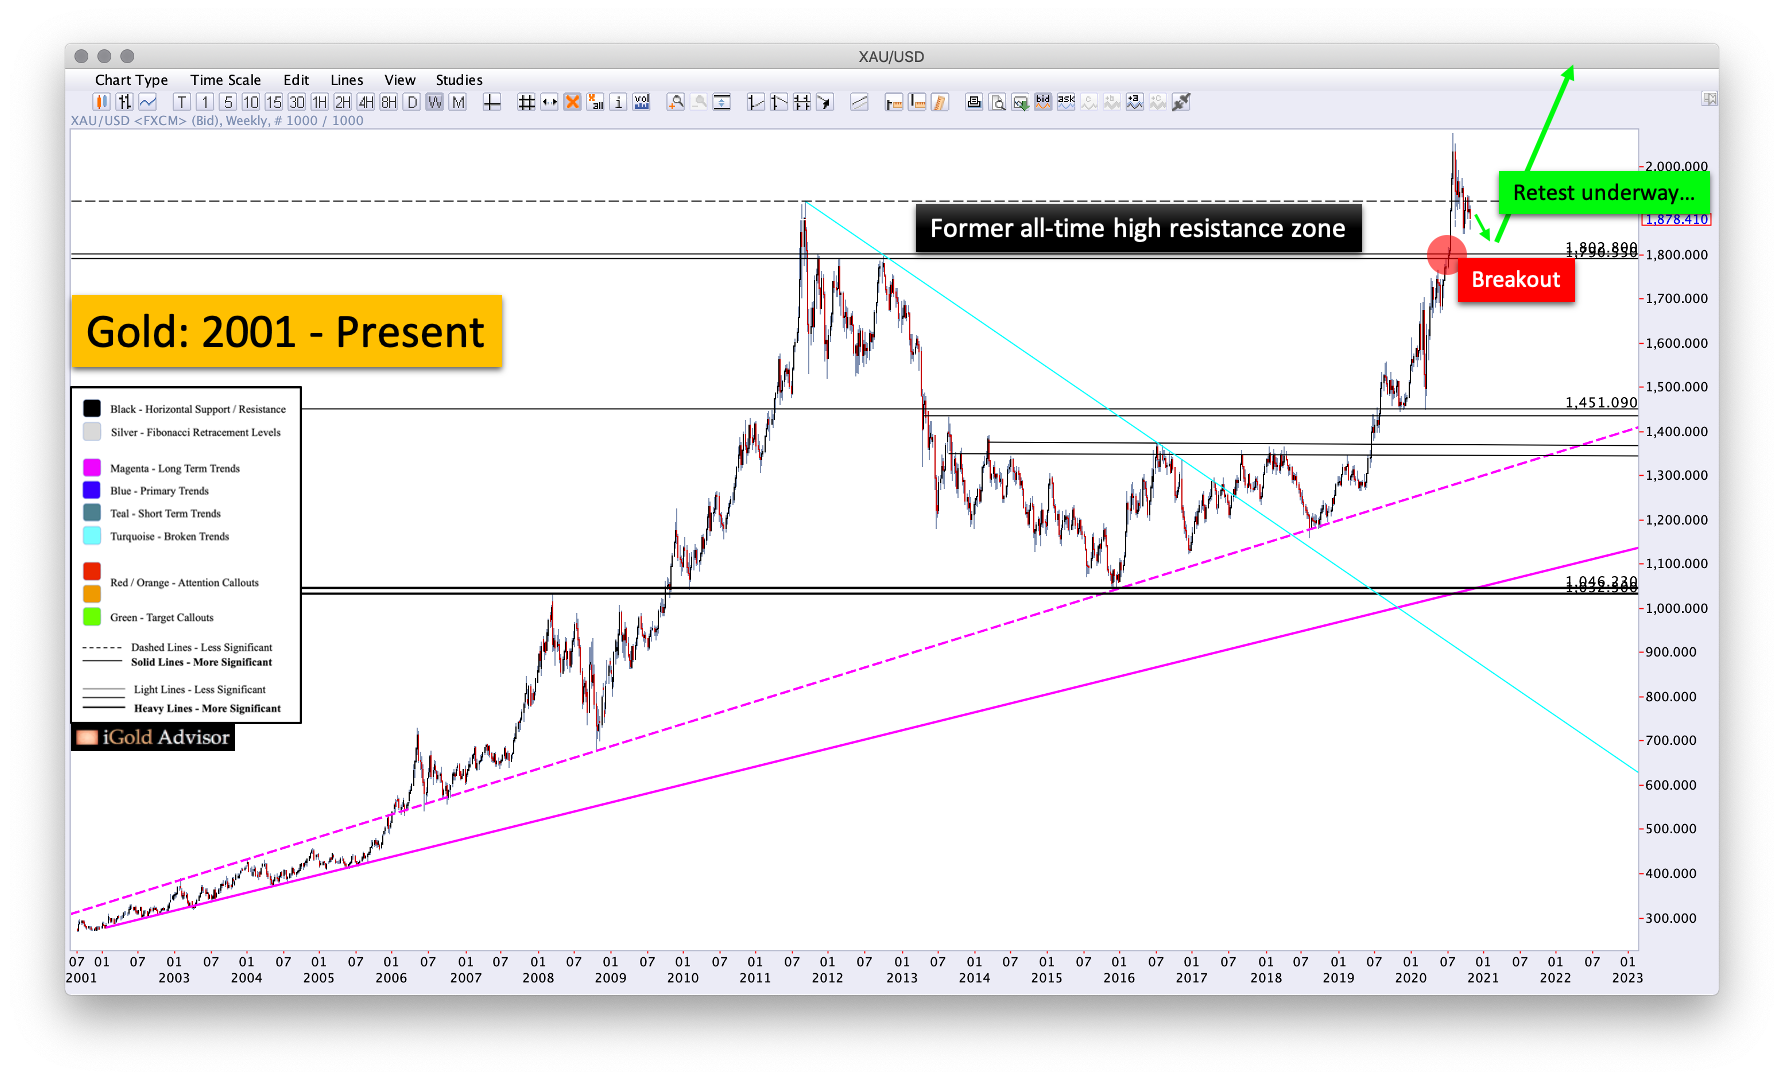
On the chart above we can see that this resistance zone existed between $1,800 and $1,920 (black). This was a region in which gold was unable to advance on four occasions between 2011 – 2012.
Following the bear market of 2011 – 2015 and subsequent recovery, gold finally broke out above its 2011 peak in early 2020 (red callout). It then subsequently made a new higher peak than in 2011 at $2,074 per ounce.
Gold is now coming back into the former resistance zone to retest that zone.
What is a retest?
A retest is a process whereby sellers are daring buyers to show up for a second time as they did during an important breakout.
The rule in technical analysis is: “Breakouts should be respected until proven otherwise.” With gold now back into the mid-$1800’s, we should expect those buyers to show up again now that the price has retreated into the former zone where the breakout first occurred.
This analysis suggests that downside is limited for gold going forward, as it should fall no further than the low $1,800’s on this correction.
Following a successful retest, a significant continuation advance is expected.
Wedge Pattern Confirms Local Bottom
Do we have any confirming or denying evidence that gold may be trying to form an important bottom in the region of its former all-time high resistance zone from 2011?
Yes we do – and it comes from a closer examination of the short-term price action:
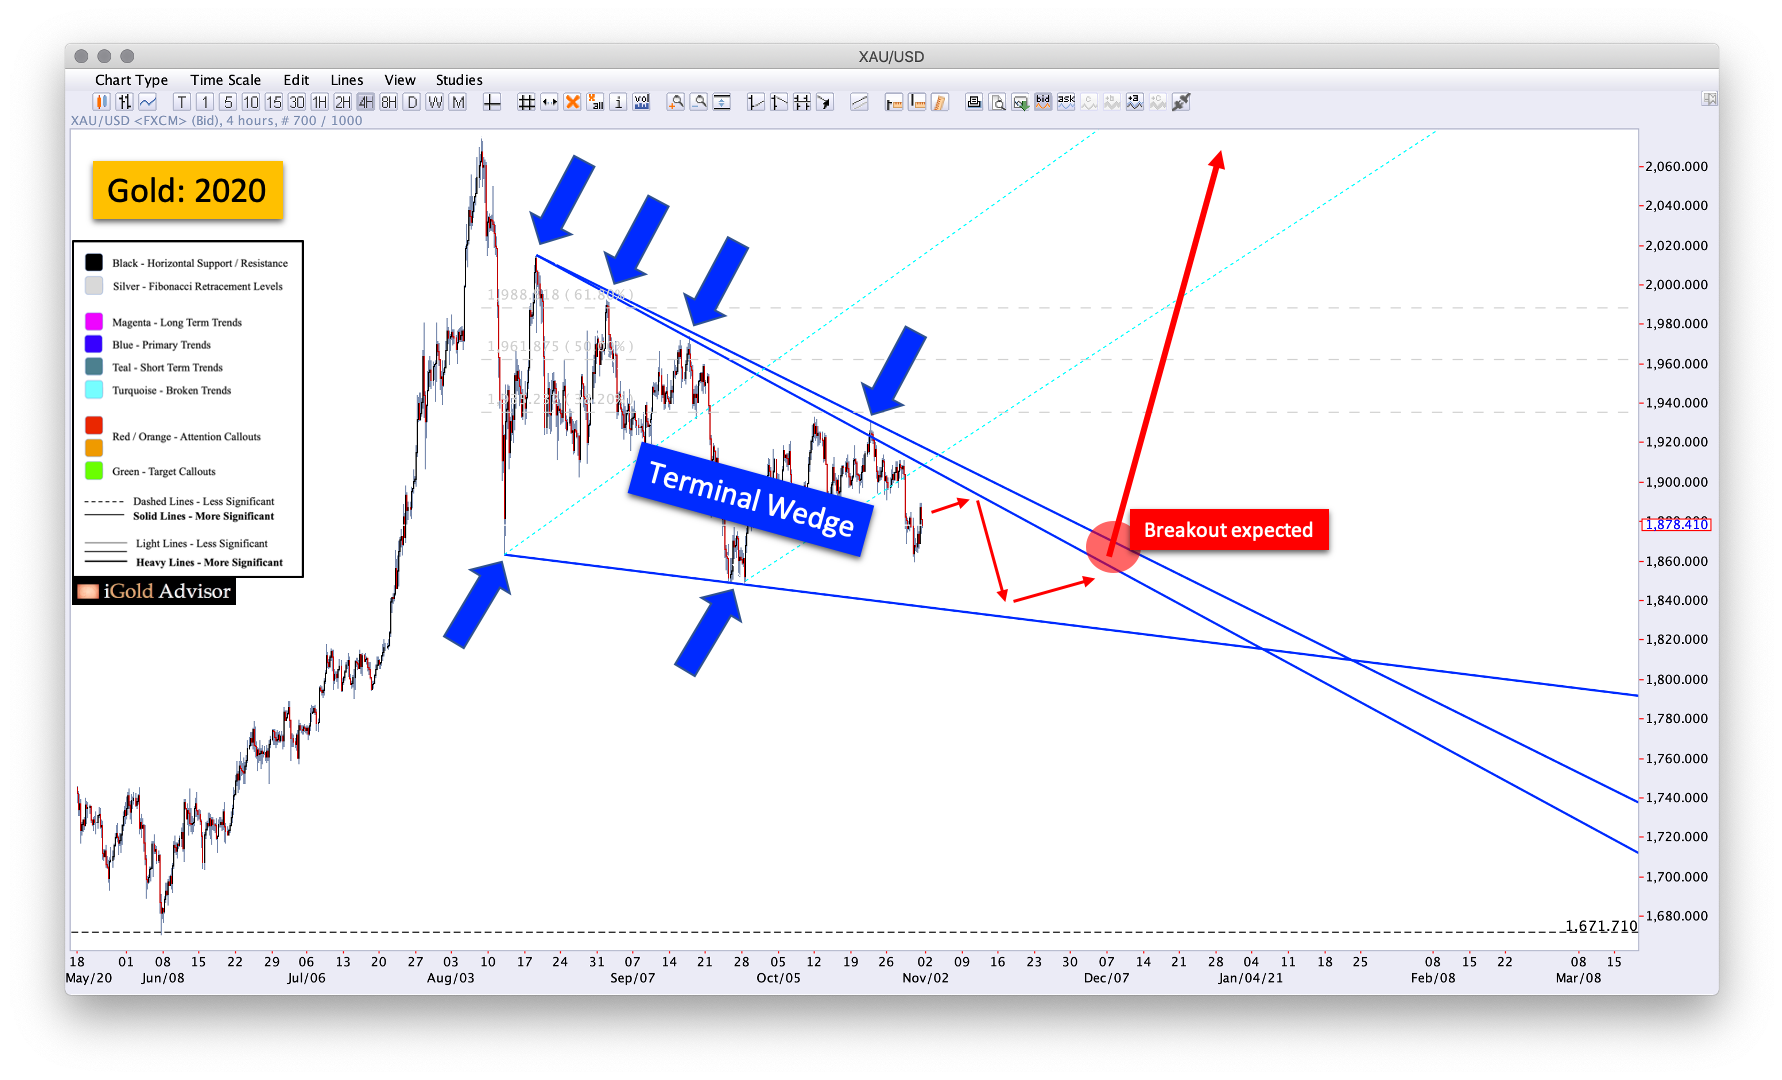
Note that gold has carved out a clear terminal wedge bottoming pattern since August, shown above in blue.
A terminal wedge is one of the more tricky bottom patterns to identify, since both sellers (upper blue arrows) and buyers (lower blue arrows) are both emerging at lower and lower intervals as time goes by. Yet the key point in identifying terminal wedges is to note that the buyers are showing up at a less steep slope than the sellers. The buyers are thus relatively more resolute in their purchases than the sellers are in their liquidation.
A terminal wedge thus typically resolves upward, as buyers eventually overwhelm sellers. To confirm this thesis, we need to see the upper declining blue boundary of the pattern broken for a daily close. As this article is going to press, the level that we need to see broken to confirm the pattern is $1,918, and declining slightly each week.
Note that one more new nominal low could still fit within this terminal wedge pattern. Thus, we should not be surprised to see gold sell off back toward $1,830 over the weeks ahead, a figure which would be just slightly below the September bottom of $1,848. The bias will remain that this pattern should break upward as long as the lower support boundary holds.
US Election the Trigger?
As per timeline, terminal wedges tend to resolve between 2/3 and 3/4 through their boundary limits. The pattern above began on August 11 and will have an apex on January 22 of next year. We thus project a breakout between late-November and mid-December, 2020.
While we cannot predict the exact fundamental trigger which will cause this series of events to unfold, the most likely scenario involves the outcome of the US election:
-
Perhaps President Trump will lose the election, yet will contest the defeat, and the final outcome will be unknown for weeks or months.
-
Perhaps President Trump will win, and then violent protests will break out around the country in similar fashion to the mid-2020 riots following the death of George Floyd.
-
Perhaps whoever wins the election will finally pass the second major Coronavirus stimulus package, which is expected to top $2.0 trillion and will thus put tremendous downward pressure on the US fiscal budget.
Again, we cannot be certain what the fundamental trigger will be. However, we can read the language of the charts: gold is forming a terminal wedge bottoming pattern, which is set to resolve in the November / December timeframe.
Something is shaping up in the world which will cause gold to break out – what will it be?
Takeaway on Gold
Gold is now retesting its former 2011 – 2012 all-time high resistance zone between $1,800 - $1,920. Following a successful retest, a major move higher is expected.
Gold is forming a classic terminal wedge bottoming pattern within the retest zone.
This short-term wedge is set to resolve in the November / December window, following the US election.
Something is brewing in the world which should cause a dramatic advance in gold late this year and into 2021.
In a future article, we will revisit this wedge pattern once it breaks, and then project price targets for gold for the pending advance.
At www.iGoldAdvisor.com we are currently preparing private clients and research subscribers for the expected move in gold and related gold mining equities.
While one more nominal new low toward $1,830 may still fit within the above pattern, investors should be finalizing positions soon, so that they do not chase gold higher once it starts advancing.
The window to finalize positions for gold investors is now.

Christopher Aaron began his career as an intelligence analyst for the CIA and Department of Defense. He served two tours to Afghanistan and Iraq between 2006 - 2009, conducting pattern-of-life mapping for military leaders.
Mapping shares similarities with technical analysis of the financial markets because both involve the interpretation of repeating patterns found in human nature. He is the founder of iGold Advisor, providing independent research and analytics on all aspects of the precious metals markets.
He speaks regularly on the cyclical patterns found within the financial markets and on international policy. He has been featured in the New York Times and NPR news amongst other financial publications.
More from Gold-Eagle


