Gold Price Forecast & Precious Metals Update


After collapsing $250 in March, gold prices have recovered, and are extending to fresh highs. However, I remain skeptical of the current advance and believe the upside, currently, is somewhat limited. I explain more in the weekly gold chart below.
Coronavirus Update: I continue to monitor new daily cases, and things appear to be getting better. Worldwide cases hit their highest-level a week ago at 101,736. Overall, the trend continues higher, but the curve is flattening, and we are no longer in an exponential rise. https://www.worldometers.info/coronavirus/coronavirus-cases/
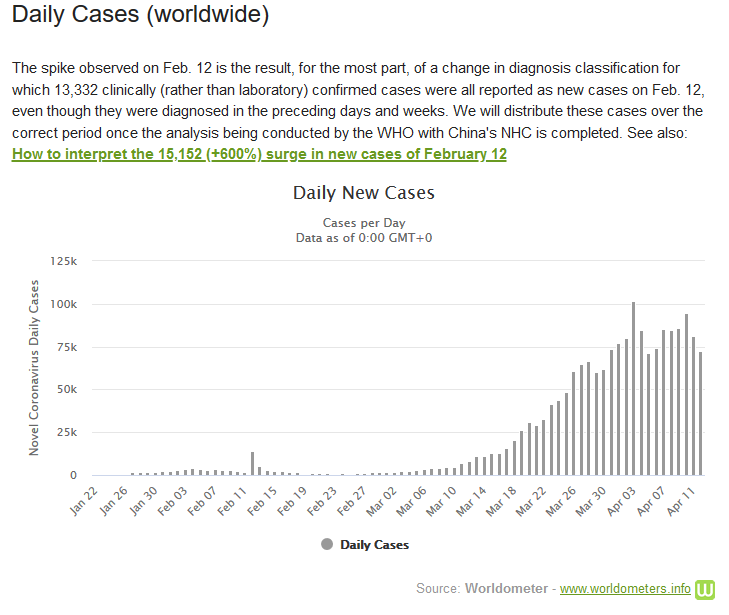
One of my biggest concerns going forward is a reemerging of the coronavirus this fall. It’s possible the quarantine measures implemented were too effective, which could lead to an even more aggressive second wave – just speculation at this point. Nevertheless, this scenario remains a possibility until there is a vaccine.
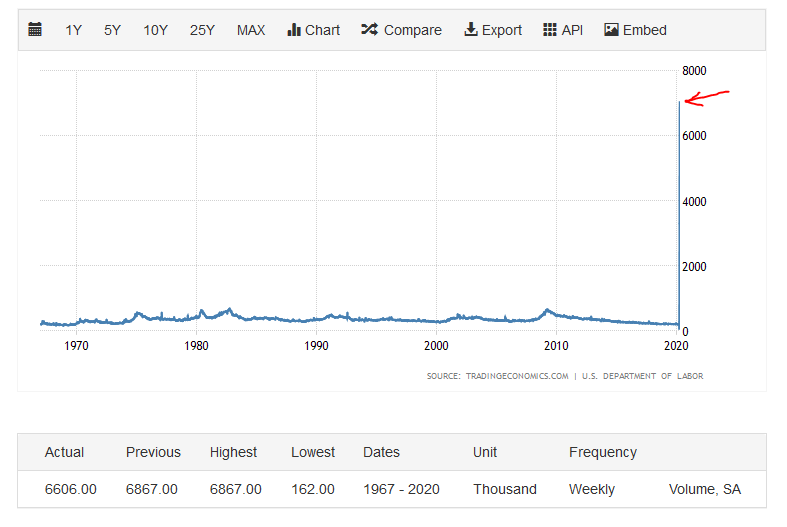
Initial Jobless Claims
I still believe the economic toll is going to be much worse than predicted. Over the last three weeks, 17-million Americans have filed for initial unemployment. To put this in perspective, look at the chart below. The current spike in unemployment is virtually off the chart. https://tradingeconomics.com/united-states/jobless-claims
We are in uncharted territory - all we can do is take this recovery one day and one week at a time. I believe strongly that precious metals will be the best performing asset class over the next 10-years. Governments will have no choice but to print money and debase their currencies. A simple accumulation model is probably best. Trying to trade these markets and picking tops/bottoms is difficult, with today’s volatility.
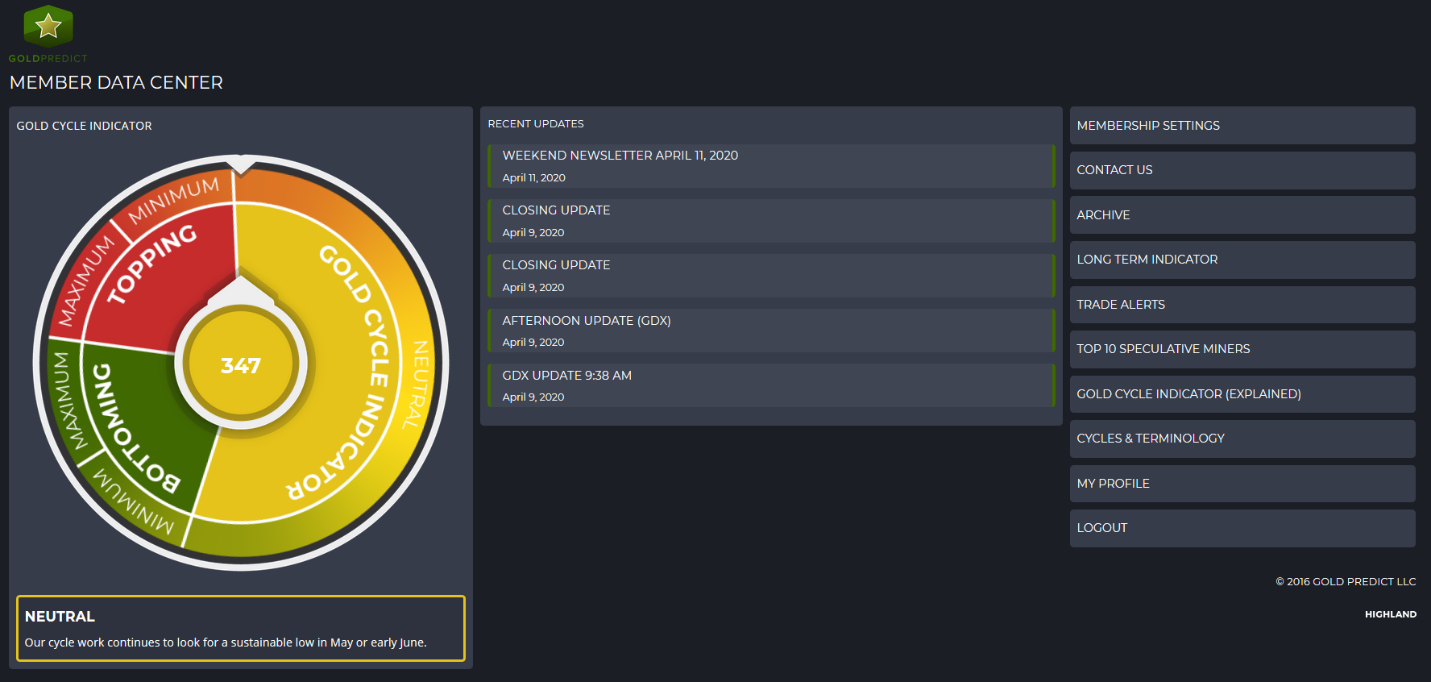
Our gold cycle indicator jumped to 347 as gold futures closed at new highs. We are once again approaching the area where we could see a top.
Gold Daily
When gold crashed from $1704.30 to $1450.90, our gold cycle indicator entered cycle bottoming territory, but I neglected to call a bottom because the timing was about 2-months premature. Therefore, I continued to look for a better opportunity in May, according to our cycles. Moreover, the March collapse lasted 5-trading days. In all my years following gold, I’ve never seen an intermediate cycle decline end in just 5-days.
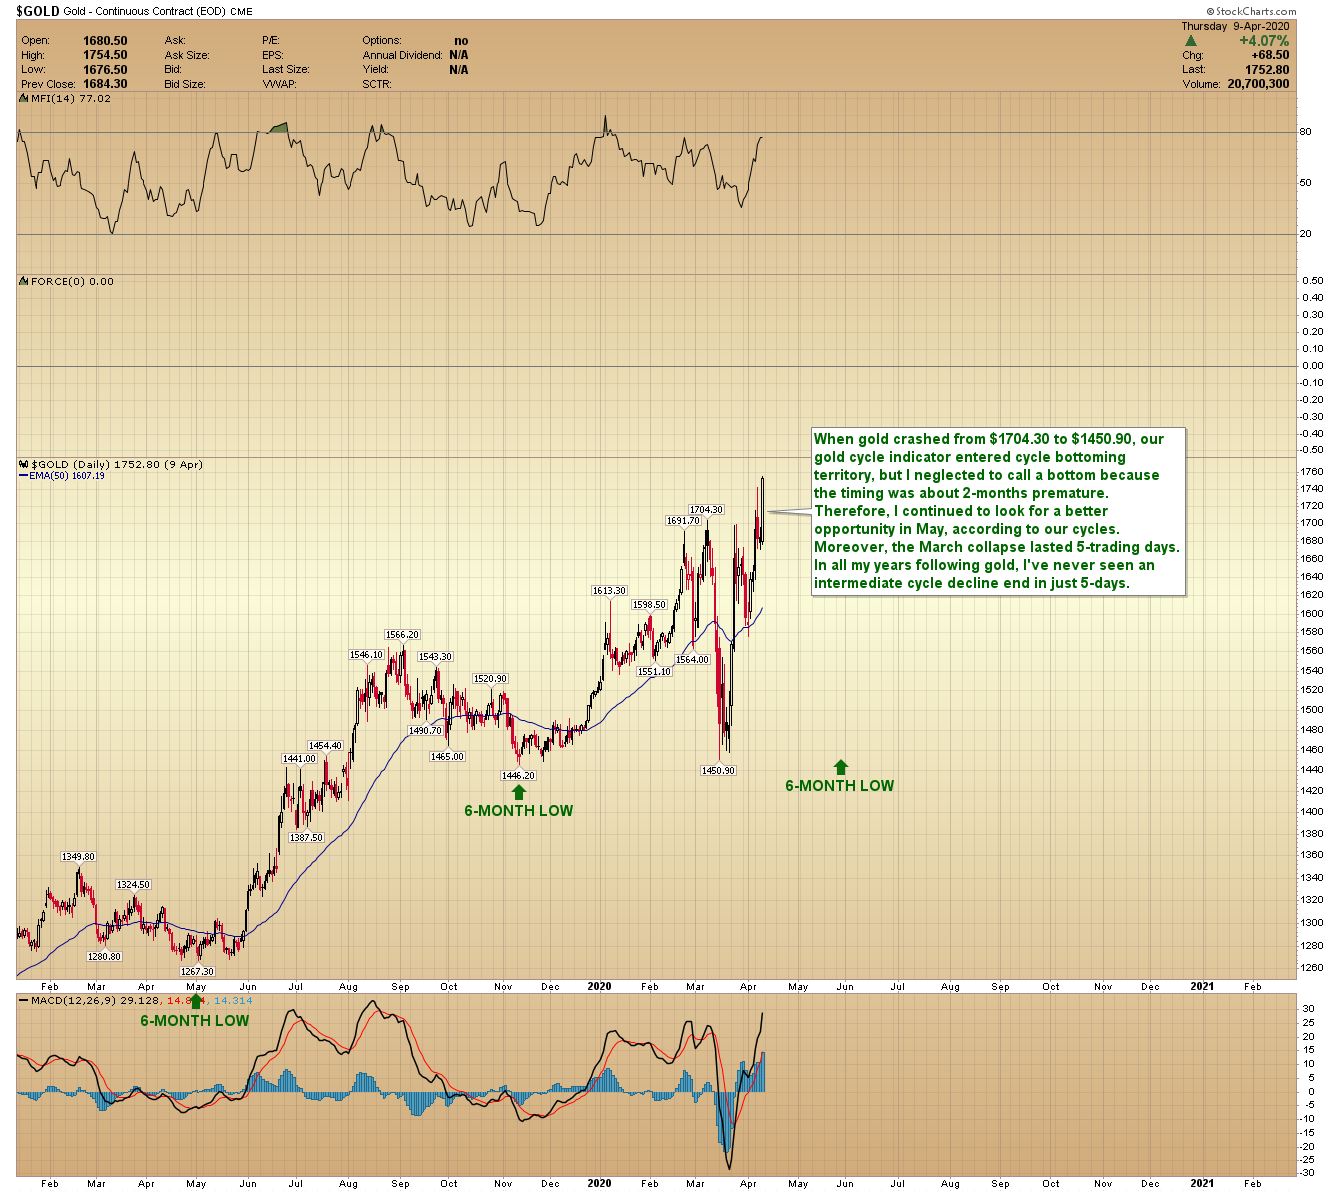
Gold just took out the March high and could extend further. Is this a new cycle or just an extension? I’m not sure, but I do believe the remaining upside in gold is somewhat limited.
Gold Weekly
The massive 10-year basing pattern in gold continues unabated. The next zone of resistance arrives around $1800. If gold were to rally above $1800 during this advance, then we could see a retest of $1900. I would say there is less than a 10% chance gold would break above $1923 on its first try. We are likely about to begin a multi-month consolidation between $1450 – $1800. Our bullish trend model doesn’t expect a breakout above $1923 until after 2021.
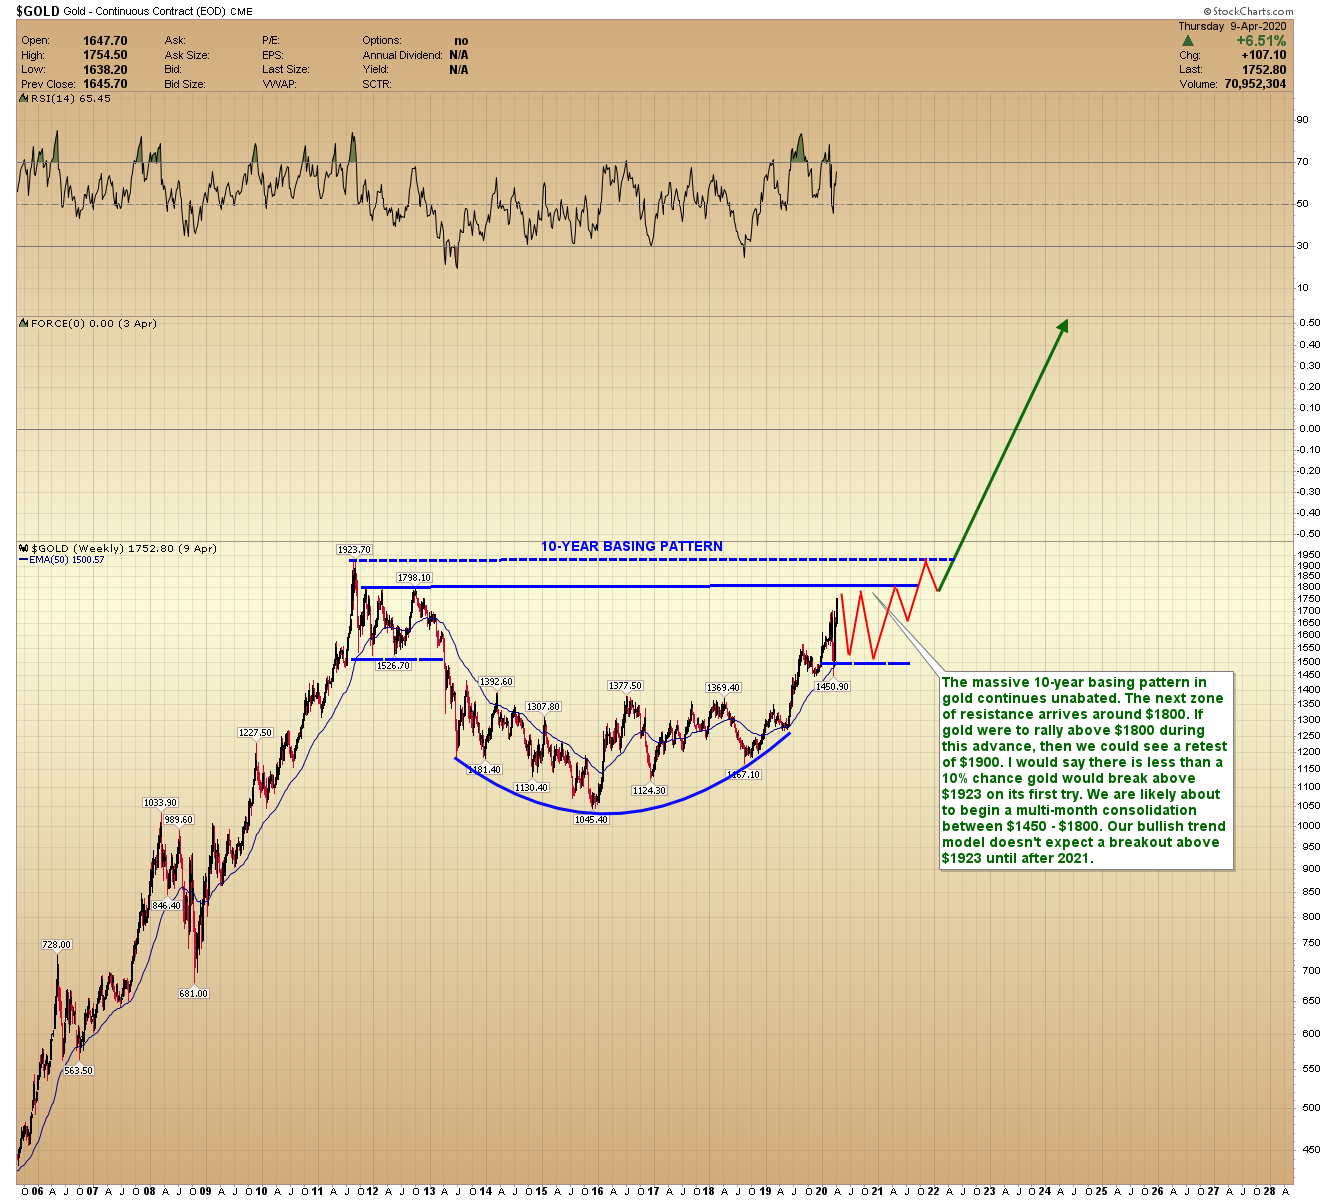
That’s what I mean when I say the remaining upside in gold is limited, at least for now. Futures finished the week at $1752.80. They could extend to $1800, maybe a little higher, but I don’t see a breakout to new all-time highs anytime soon.
Silver Weekly
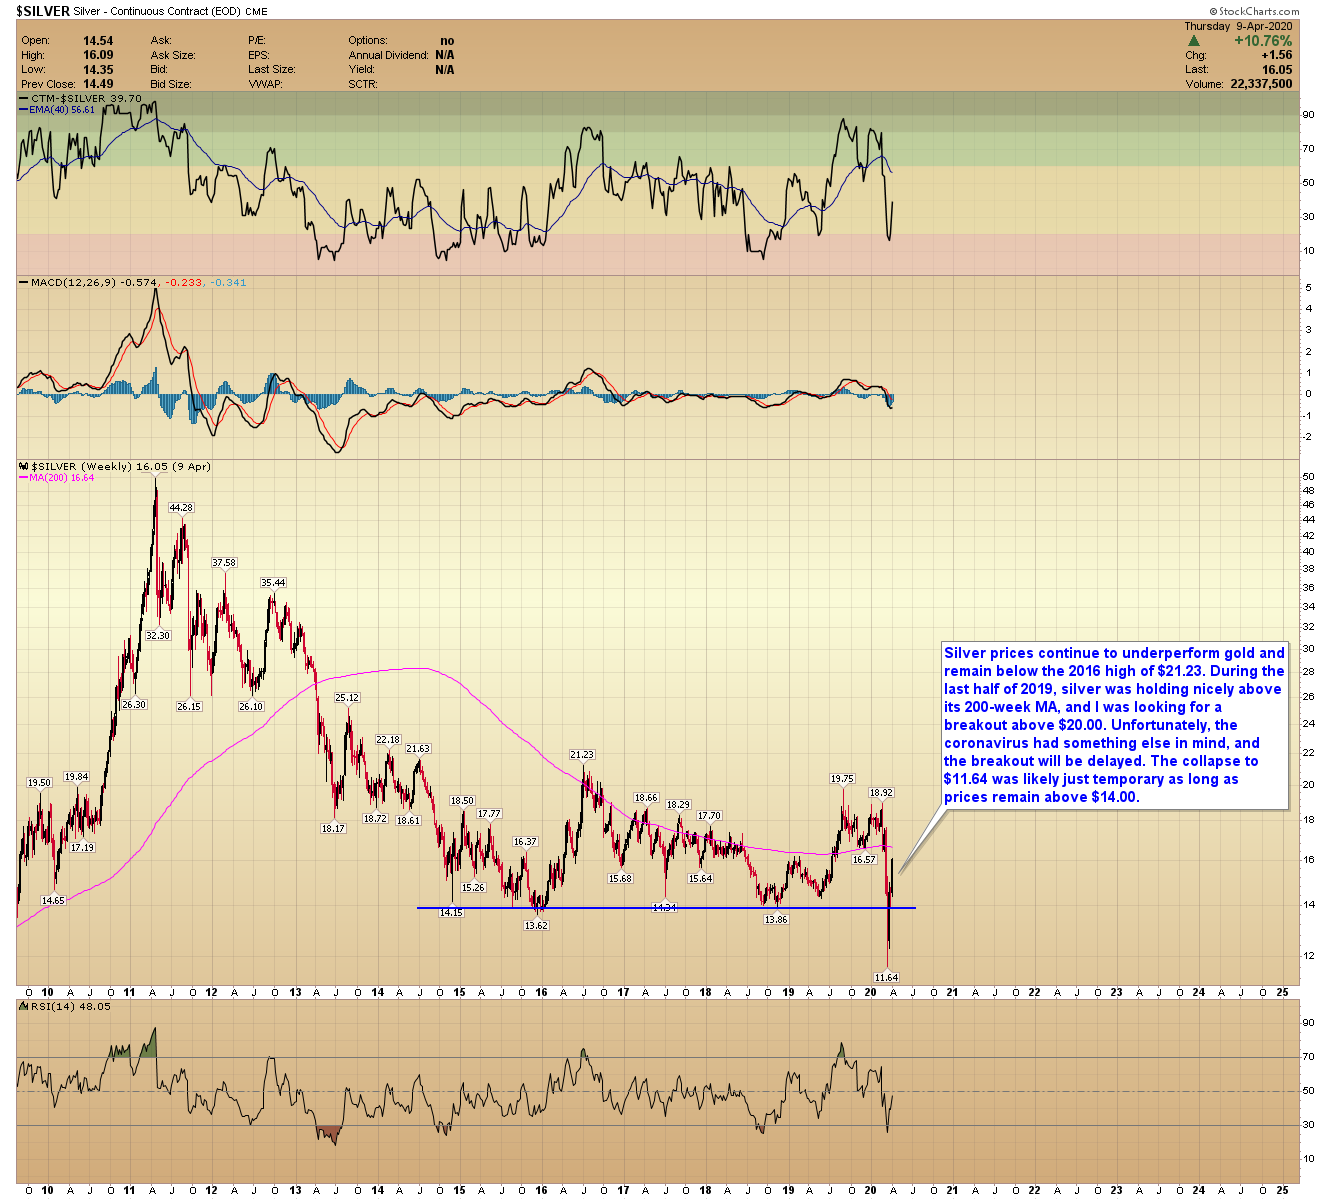
Silver prices continue to underperform gold and remain below the 2016 high of $21.23. During the last half of 2019, silver was holding nicely above its 200-week MA, and I was looking for a breakout above $20.00. Unfortunately, the coronavirus had something else in mind, and the breakout will be delayed. The collapse to $11.64 was likely just temporary as long as prices remain above $14.00.
Silver Daily
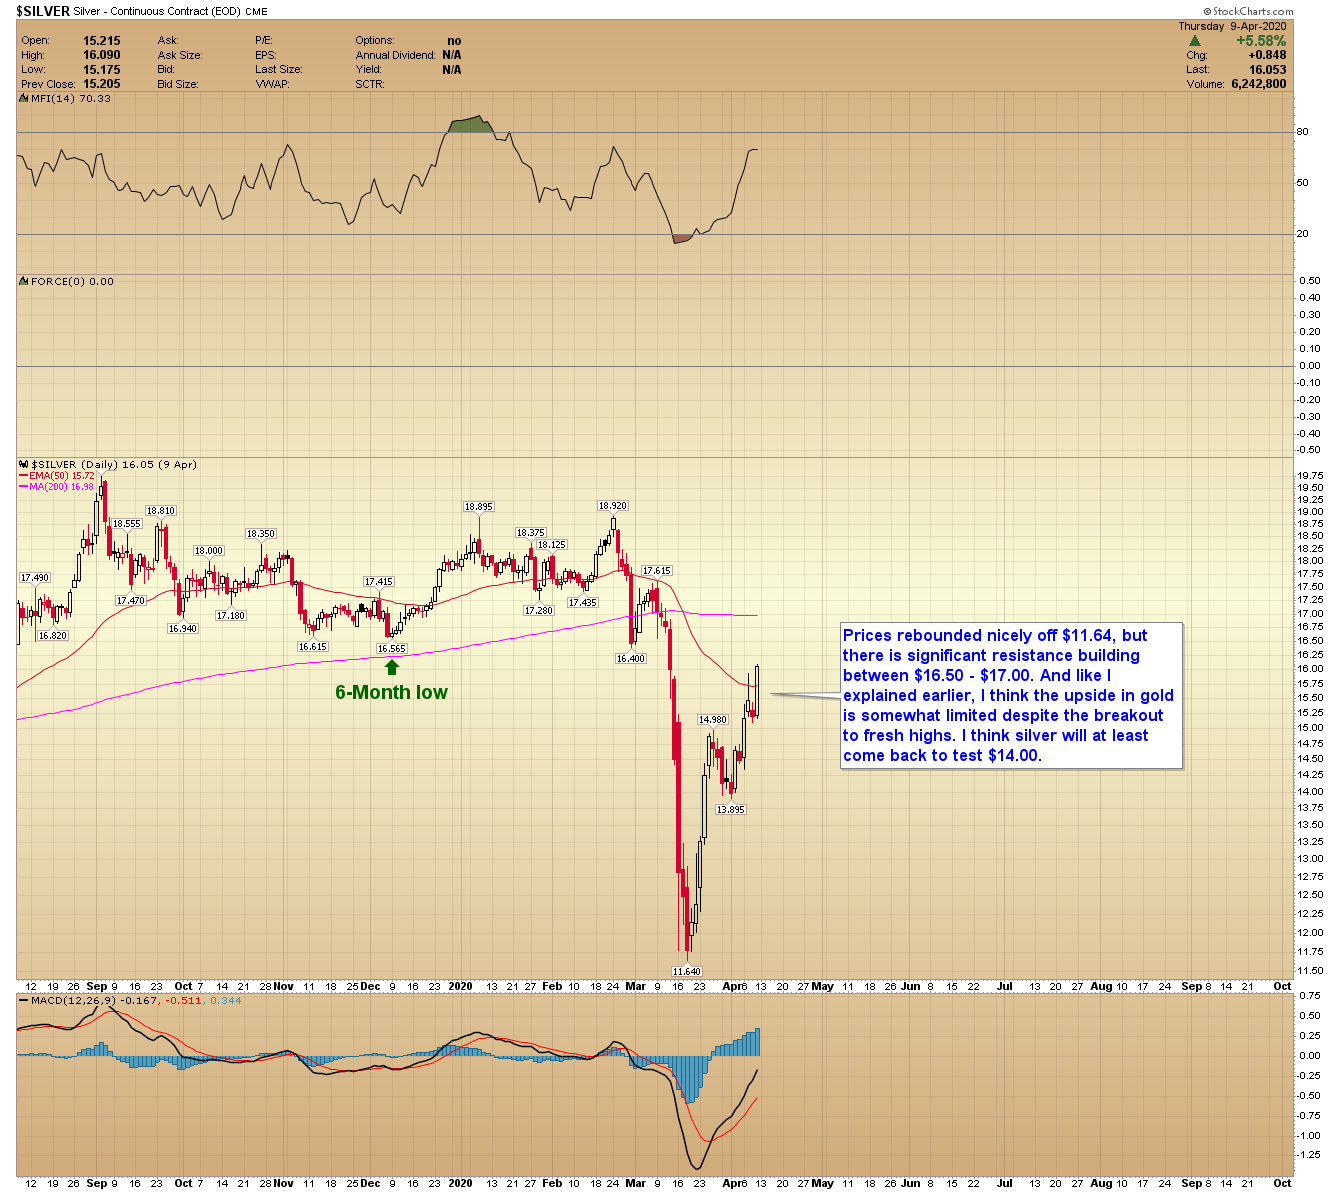
Prices rebounded nicely off $11.64, but there is significant resistance building between $16.50 – $17.00. And like I explained earlier, I think the upside in gold is somewhat limited despite the breakout to fresh highs. I think silver will at least come back to test $14.00.
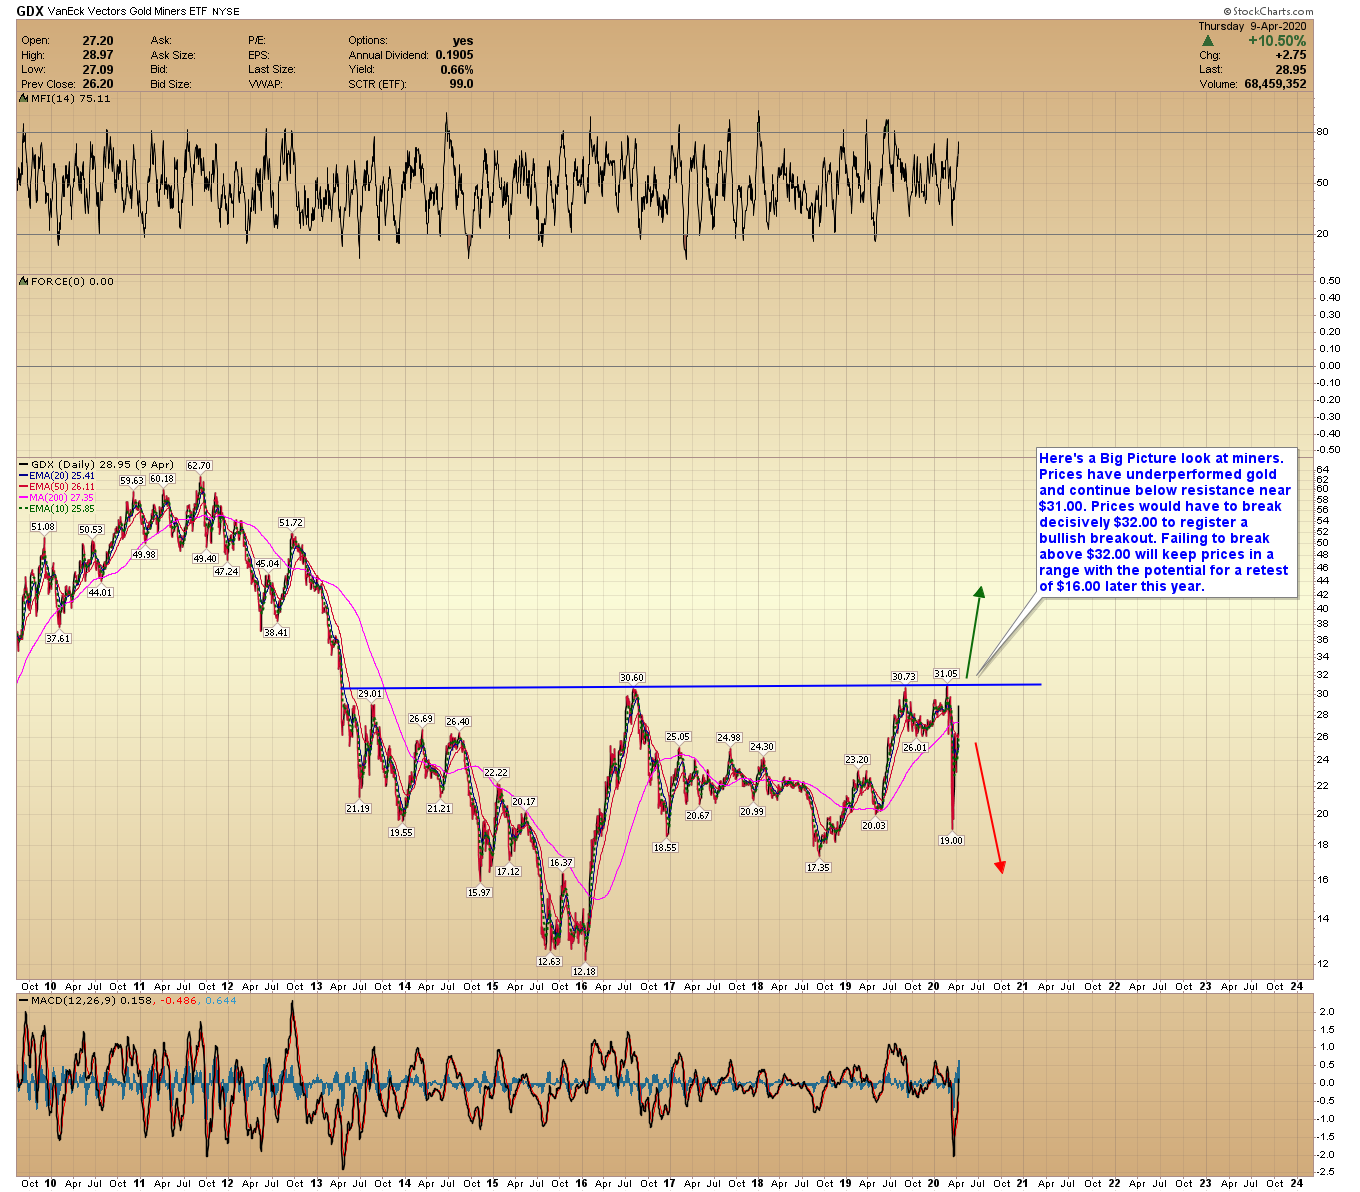
GDX Long-Term
Here’s a Big Picture look at miners. Prices have underperformed gold and continue below resistance near $31.00. Prices would have to break decisively $32.00 to register a bullish breakout. Failing to break above $32.00 will keep prices in a range with the potential for a retest of $16.00 later this year.
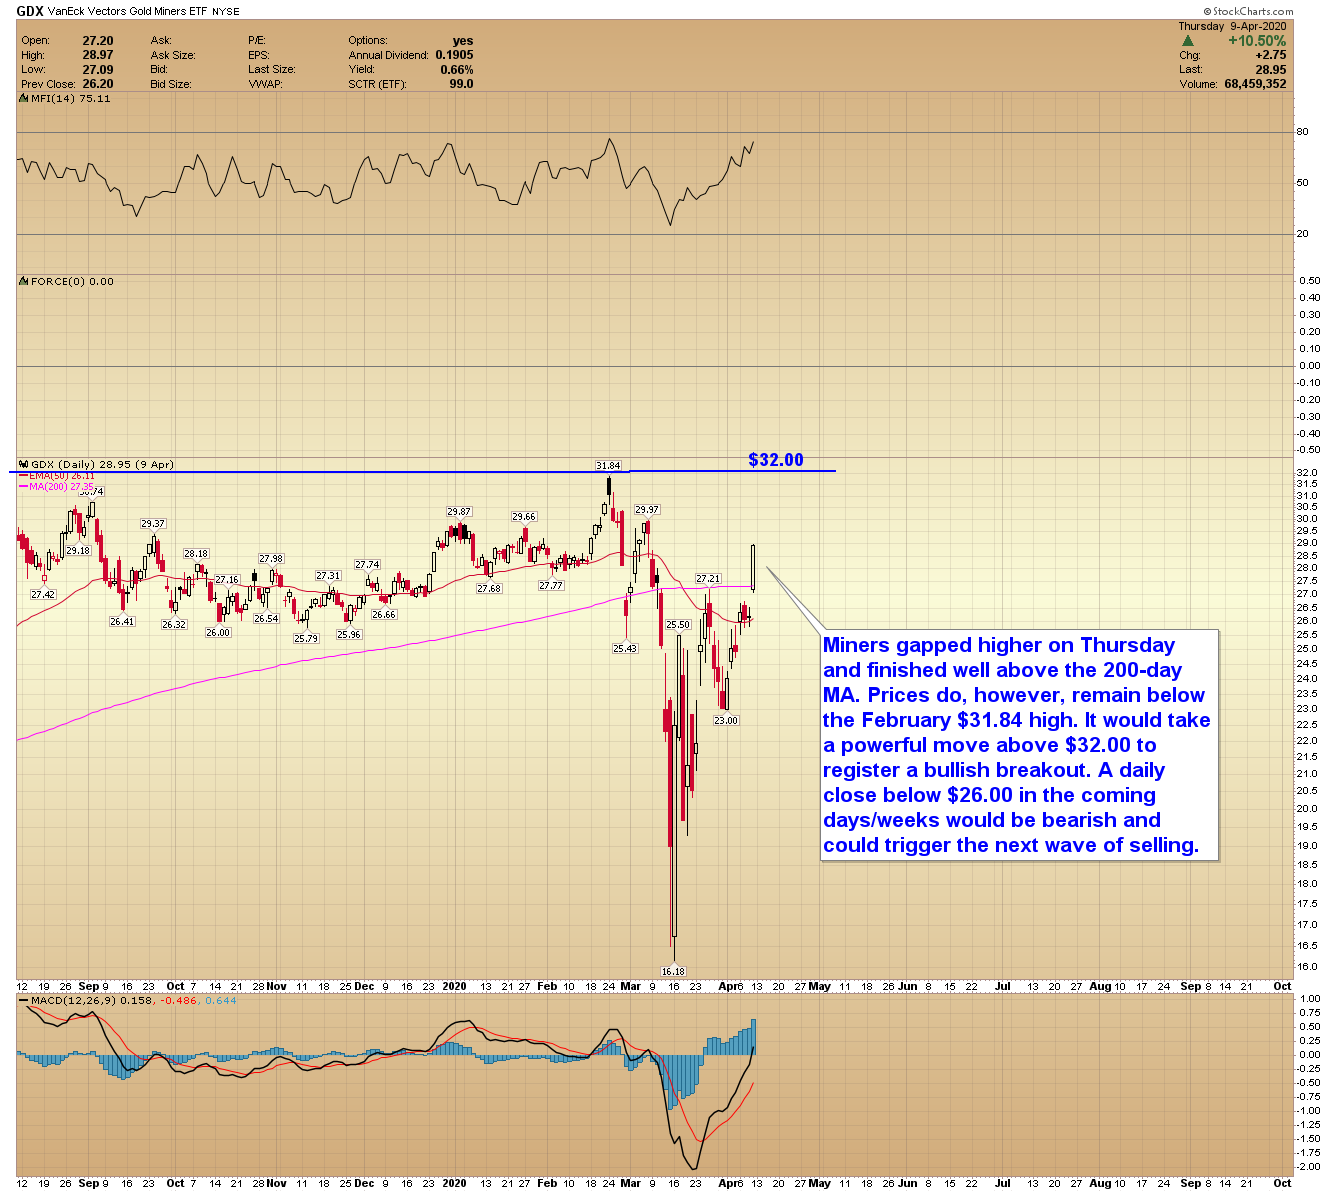
GDX Daily
Miners gapped higher on Thursday and finished well above the 200-day MA. Prices do, however, remain below the February $31.84 high. It would take a powerful move above $32.00 to register a bullish breakout. A daily close below $26.00 in the coming days/weeks would be bearish and could trigger the next wave of selling.
- Companies will begin reporting earnings next week - I expect some horrible numbers.
- I'll be keeping an eye on bankruptcies, especially in the energy sector.
- Be patient - I don’t think the economic pain is over.
- Longer-term, this crisis is exactly what precious metals needed to kickstart demand and the next leg of the bull market.
AG Thorson is a registered CMT and expert in technical analysis. He believes we are in the final stages of a global debt super-cycle. For more information, please visit here.