Gold Price Forecast: Prices Are Heating Back Up


Since late March, I’ve been tracking what seems to be a bottoming process in gold, after a substantial correction since last August.
For the first time since April of last year, gold has a bullish MACD crossover on the weekly chart:
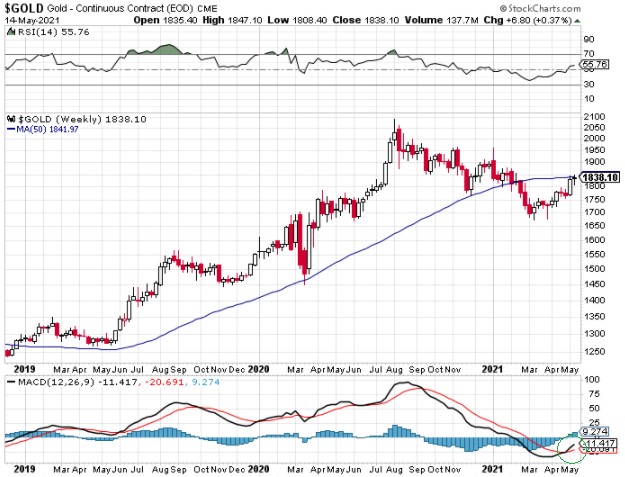
And importantly, the fundamentals are supportive of a trend reversal as well.
As I’ve written about before, gold’s single strongest inverse correlation is with inflation-adjusted yields of long-duration Treasuries. This chart shows the price of gold in red on the right axis, and inflation-adjusted 10-year Treasury yields (nominal yields minus TIPS inflation breakevens) in blue on the left axis:
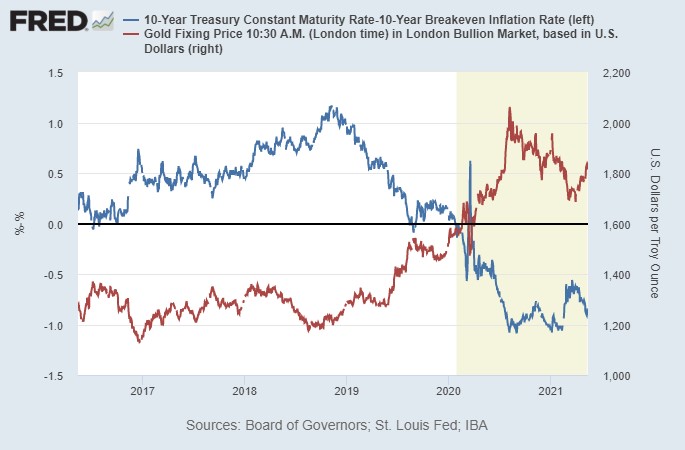
Chart Source: St. Louis Fed
After rising from its cycle low since last August, the inflation-adjusted 10-year Treasury rate has been rolling over again, as gold formed a rounded bottom.
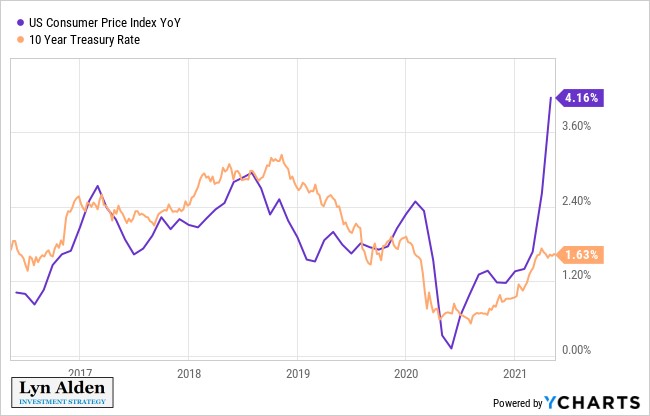
With inflation running hot this spring and summer, there are good reasons to expect inflation-adjusted Treasury yields to reach a new cycle low. Indeed, as measured by 10-year Treasury yields minus current year-over-year CPI changes, the gap is already widening considerably:
We can also compare gold to other commodities, such as copper.
Over the past thirty years, gold has been steadily gaining on copper, as a monetary metal would be expected to do compared to an industrial metal. In other words, the copper-to-gold ratio has steadily gone down in a cyclical fashion. The main exception was during the mid-2000s copper bubble from China’s growing demand. The ratio is now closer to the upper end of that channel, meaning it wouldn’t be surprising to start seeing the ratio roll back over in gold’s favor in the second half of this year.
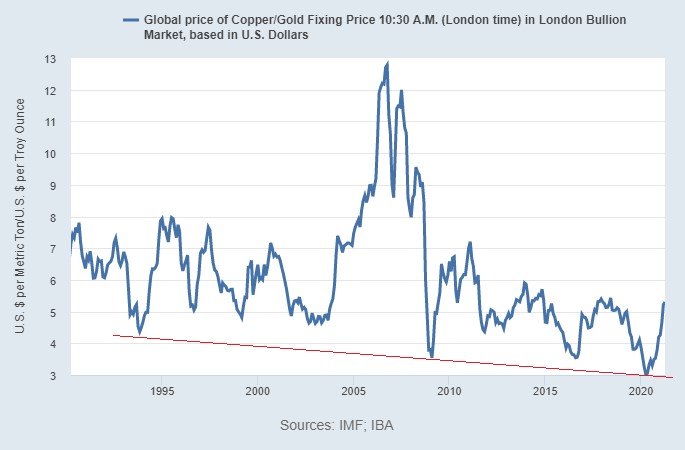
Chart Source: St. Louis Fed
But as solid as gold looks here, the gold miners arguably look even better.
Back during the gold bull-run, all the way up to its 2011 highs, gold miners didn’t control input costs very well and ended up not being able to generate much free cash flow. After a decade of gold prices going up hundreds of percentage points, the miners had little to show for it.
During the multi-year gold bear market that went through 2015, many management teams were changed, and gold miners generally began emphasizing profitability and stronger balance sheets.
If we look at Barrick Gold, for example, they are generating a ton of free cash flow now. This chart shows free cash flow in green:
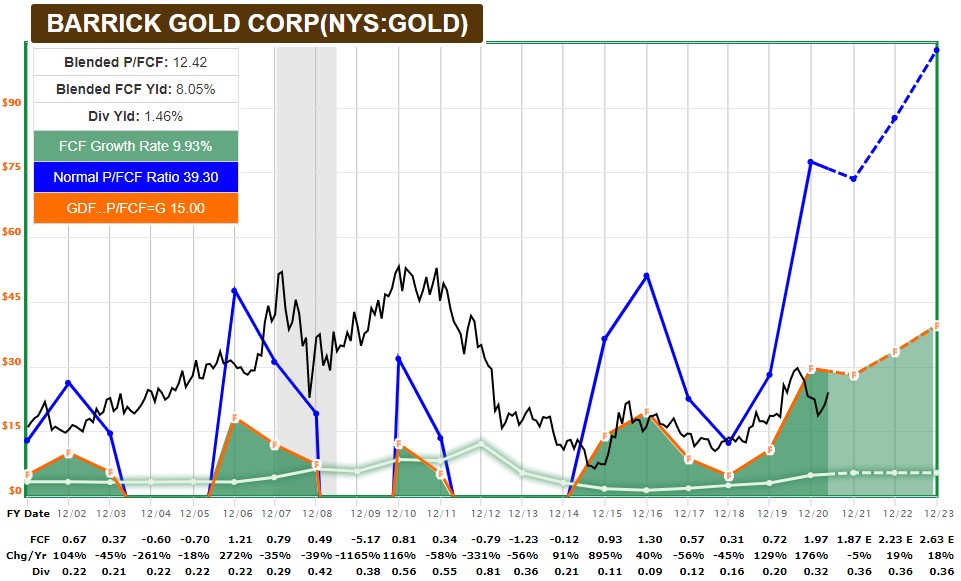
Chart Source: F.A.S.T. Graphs
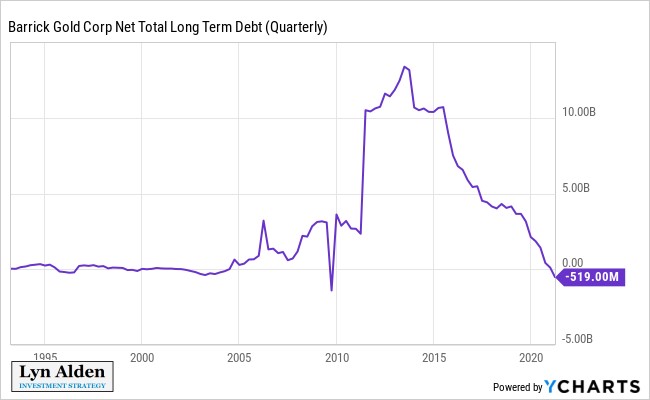
And in Barrick’s case, they have been using a lot of that free cash flow to pay down debt. In fact, they now have more cash than long-term debt, which gives them a negative net debt position. Barrick’s balance sheet was terrible several years ago, but now has never been so good:
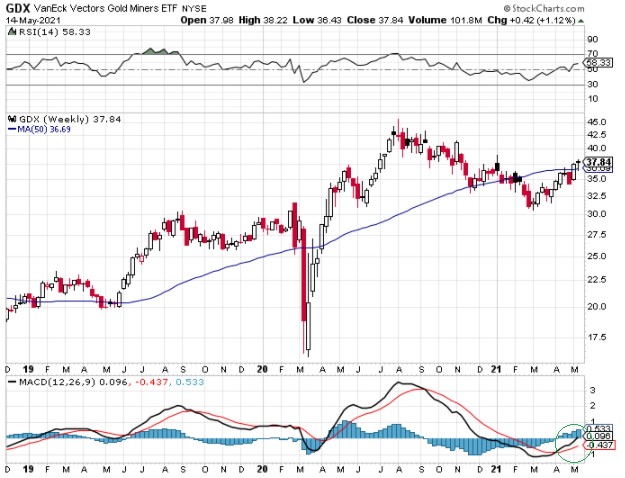
Along with the price of gold itself, the gold miner ETF (GDX) has been showing a trend reversal recently, with a positive MACD crossover on the weekly chart:
The entire market capitalization of gold is estimated to be under $12 trillion, of which only a subset of that is used for private investment. This is a tiny fraction of an estimated $500 trillion in global household assets, including stocks, bonds, cash, and real estate.
As over $100 trillion of cash and sovereign bonds around the world fails to provide a yield that keeps up with inflation, it makes sense for gold to continue to expand and take some of that market share.
I remain bullish on gold, with a base case for new all-time highs in the years ahead. Gold miners, meanwhile, are attractive value investments even at current gold prices, let alone higher gold prices that may occur.
*********


