Gold Price Forecast: Pullback Ahead – How Low?


 Gold may be set for a further pullback before a resumption of the bull market is ready. Traders should position for short-term weakness, yet investors should use the dip as a final buying opportunity before higher prices.
Our most significant clue that a pullback may be due for bullion itself comes from the gold mining complex. Below we show the GDX senior gold miners fund from 2020 to present:
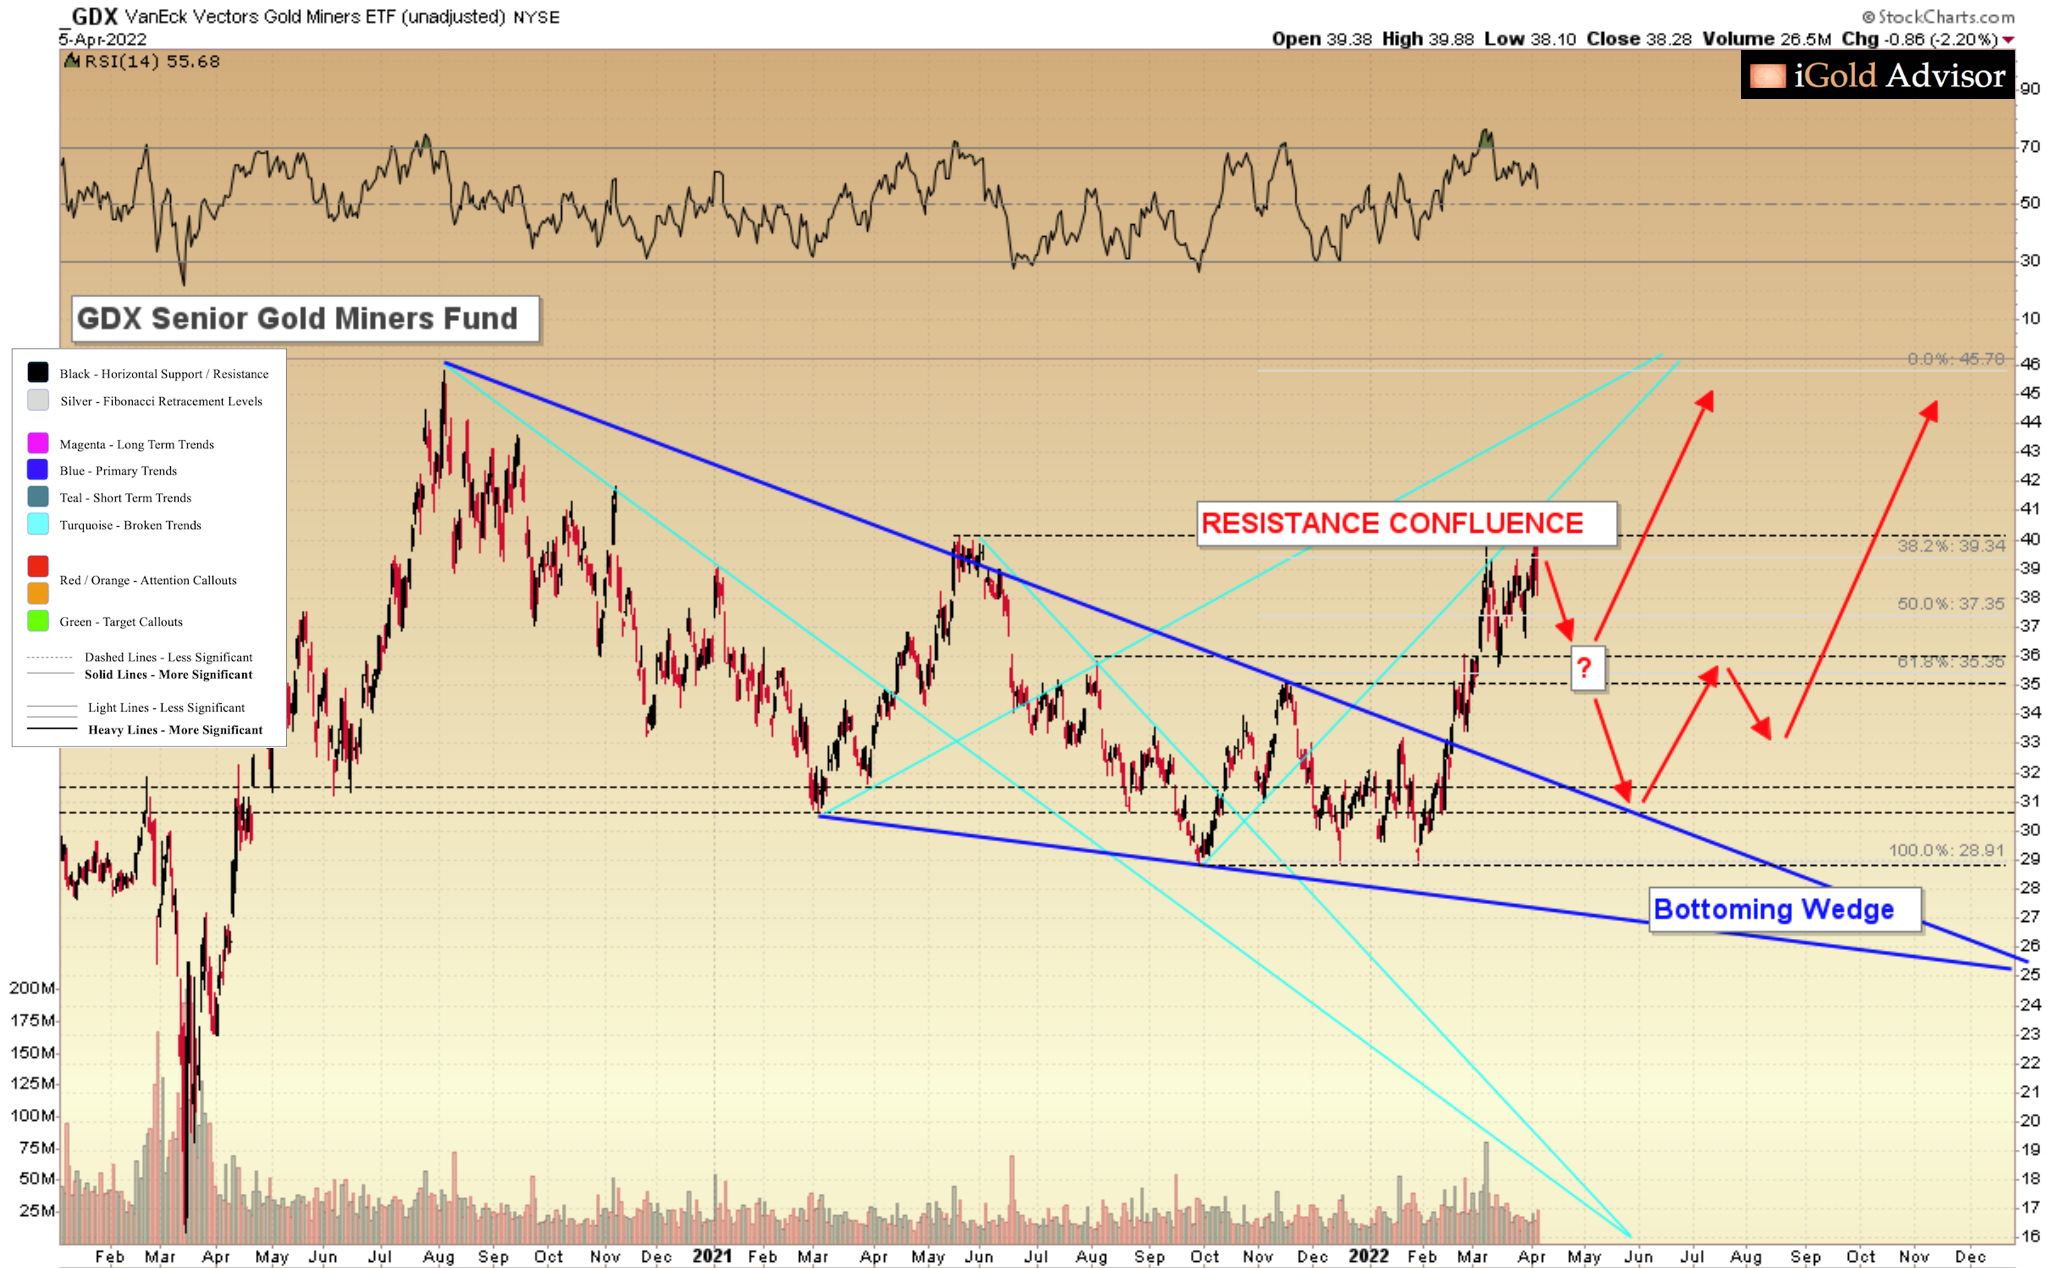
Note that the gold miners are facing a significant resistance confluence in the 40.0 region. Three separately derived but equally important resistance levels converge in this region. They are:
- The 2021 peak for the gold miners at 40.0, achieved last May (black dashed line).
- Broken trend support à turned resistance from the September 2021 bottom at 41.0 (turquoise line).
- The 38.2% Fibonacci level of the entire 2020 – 2022 decline, which comes in at 39.3 (light silver line).
When three separate resistance levels all converge within 1.7 points on the chart, that zone becomes significant overhead resistance.
We thus expect that in the case of the gold mining complex, the GDX will retreat over the near-term.
How Low for the GDX?
The first moderate support level for the GDX comes in at the 35.0 level, representing broken swing peaks back from August and November 2021. Those peaks are shown above by the light black dashed lines.
It is likely that the GDX will thus retreat at least 12%, from near 40.0 down to 35.0 over the coming weeks.
However, the 35.0 level is an initial support level only.
Stronger support for the GDX exists down at 32.0, representing the former resistance of the bottoming wedge pattern that was broken higher in February (upper blue line).
Should the GDX decline all the way to 32.0, it would represent a 20% decline for the large-cap gold miners.
We will evaluate these support levels as they begin to be tested. For now, we should expect the GDX to decline toward anywhere from 35.0 to 32.0 over the coming weeks, or a 12% to 20% correction.
How Low for Gold?
The gold miners are not going to decline in a vacuum. Gold will likely be taken down further with them.
From $1,925 per ounce in the spot market as this is going to press, how low could gold fall before we see strong support emerge?
Below is the primary gold chart from 2018 through present:
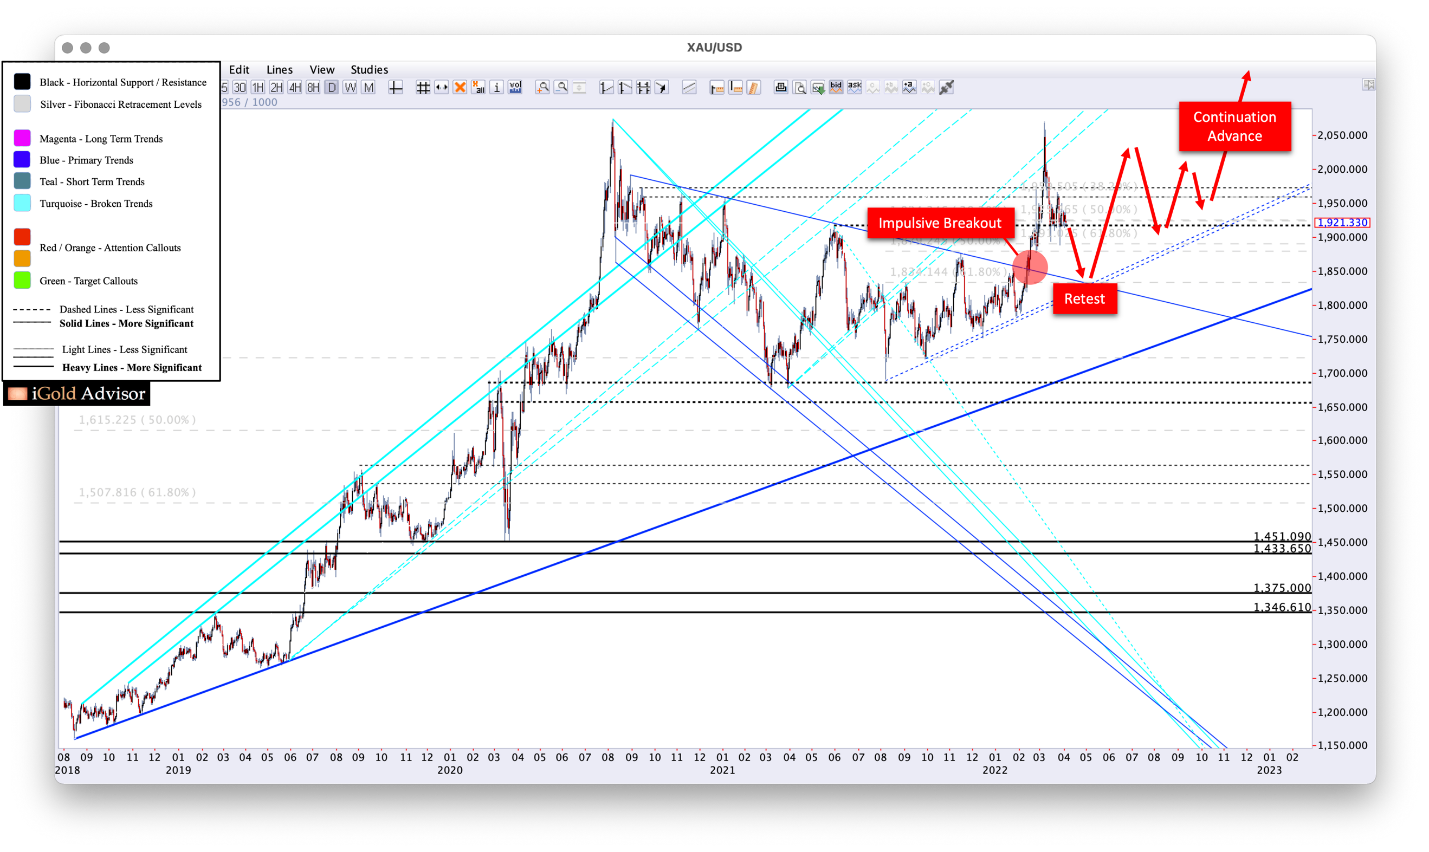
- Note the impulsive breakout from the 18-month consolidation which occurred in early February 2022 (red callout), as Russia invaded Ukraine.
- As noted in our 2018 article “What Affects the Price of Gold?” (approx. 2/3 down the article - link: https://news.gold-eagle.com/article/what-affects-price-gold/957), geopolitical-based price spikes, such as what occurred after September 11, 2001, are nearly always reversed in the months following the advance. Yet as long as the key support level holds, this two-steps-forward à almost two-steps-backward process can indeed be part of a larger trend change higher.
- In the case of gold now, the key declining breakout level was $1,850 back in early February (blue line, red callout). Since this was a slowly declining trend of resistance, a retest in the future could occur at a slightly lower level than the actual breakout point.
- Thus, if the broken 18-month consolidation were to be retested within the next several weeks, such a retest would occur as low as $1,830 - $1,840.
- After the retest, gold should then find support via emerging second-chance buyers. It should consolidate then for several months, before a continuation advance becomes the highest probability based on a subsequent fundamental trigger.
Takeaway on Gold
The GDX gold miners fund is facing clear resistance in the 40 region, which is expected to hold down the price for the time being. Any decline should be in the 12% - 20% range.
Gold should decline with the GDX. Gold’s next strong support is in the $1,830 - $1,840 range. While this would represent a complete reversal of the Russia / Ukraine premium over the last two months, as long as the support level holds, this entire process may be seen as the beginning of a new trend higher in development, similar to the price action in gold which occurred after September 11, 2001.
Those highly exposed to leveraged forms of gold may wish to initiate some defensive sales.
Yet long-term precious metals investors may have a final lucrative buying opportunity coming over the next 1 – 2 months.
At www.iGoldAdvisor.com, we work with investors from across the spectrum to provide education on the precious metals sector. We work with complete beginners all the way to those diversifying multi-million dollar portfolios. In addition to bullion and equities, we make highly-leveraged investments via private placements, which offer investors free warrants in gold mining companies in addition to their shares.
*******

Christopher Aaron began his career as an intelligence analyst for the CIA and Department of Defense. He served two tours to Afghanistan and Iraq between 2006 - 2009, conducting pattern-of-life mapping for military leaders.
Mapping shares similarities with technical analysis of the financial markets because both involve the interpretation of repeating patterns found in human nature. He is the founder of iGold Advisor, providing independent research and analytics on all aspects of the precious metals markets.
He speaks regularly on the cyclical patterns found within the financial markets and on international policy. He has been featured in the New York Times and NPR news amongst other financial publications.


