Gold Price Forecast: A Significant Top Is Ahead


Gold has been on a tear recently. The precious metal is up nearly $250 over the last three weeks following the unlimited quantitative easing (QE, a.k.a. money creation) plan announced by the Federal Reserve on March 23 in response to the Coronavirus pandemic. Gold is now back to levels not seen since 2012.
So what is in store for gold? Is now a good time to buy?
While those without any precious metals exposure whatsoever would be wise to establish a core holding as an insurance policy against unprecedented central bank monetary debasement, there are important warning signs appearing within the market which show us that precious metals may be due for a significant retracement of the recent gains. It is possible that the retracement may start following one final surge; however, our highest expectation remains that gold is due to give back at least several hundred dollars of its recent advance within the coming year. Investors should be careful about chasing recent price gains.
Gold Miners Do Not Believe It
Investors in the gold mining complex do not believe the recent price increase in gold itself.
Below we plot the GDX large cap gold mining fund on top, which contains an average valuation of 50 gold miners, followed by the price of gold itself immediately below. The chart shows data dating from the 2011 peak in gold at $1,923 per ounce through the present:
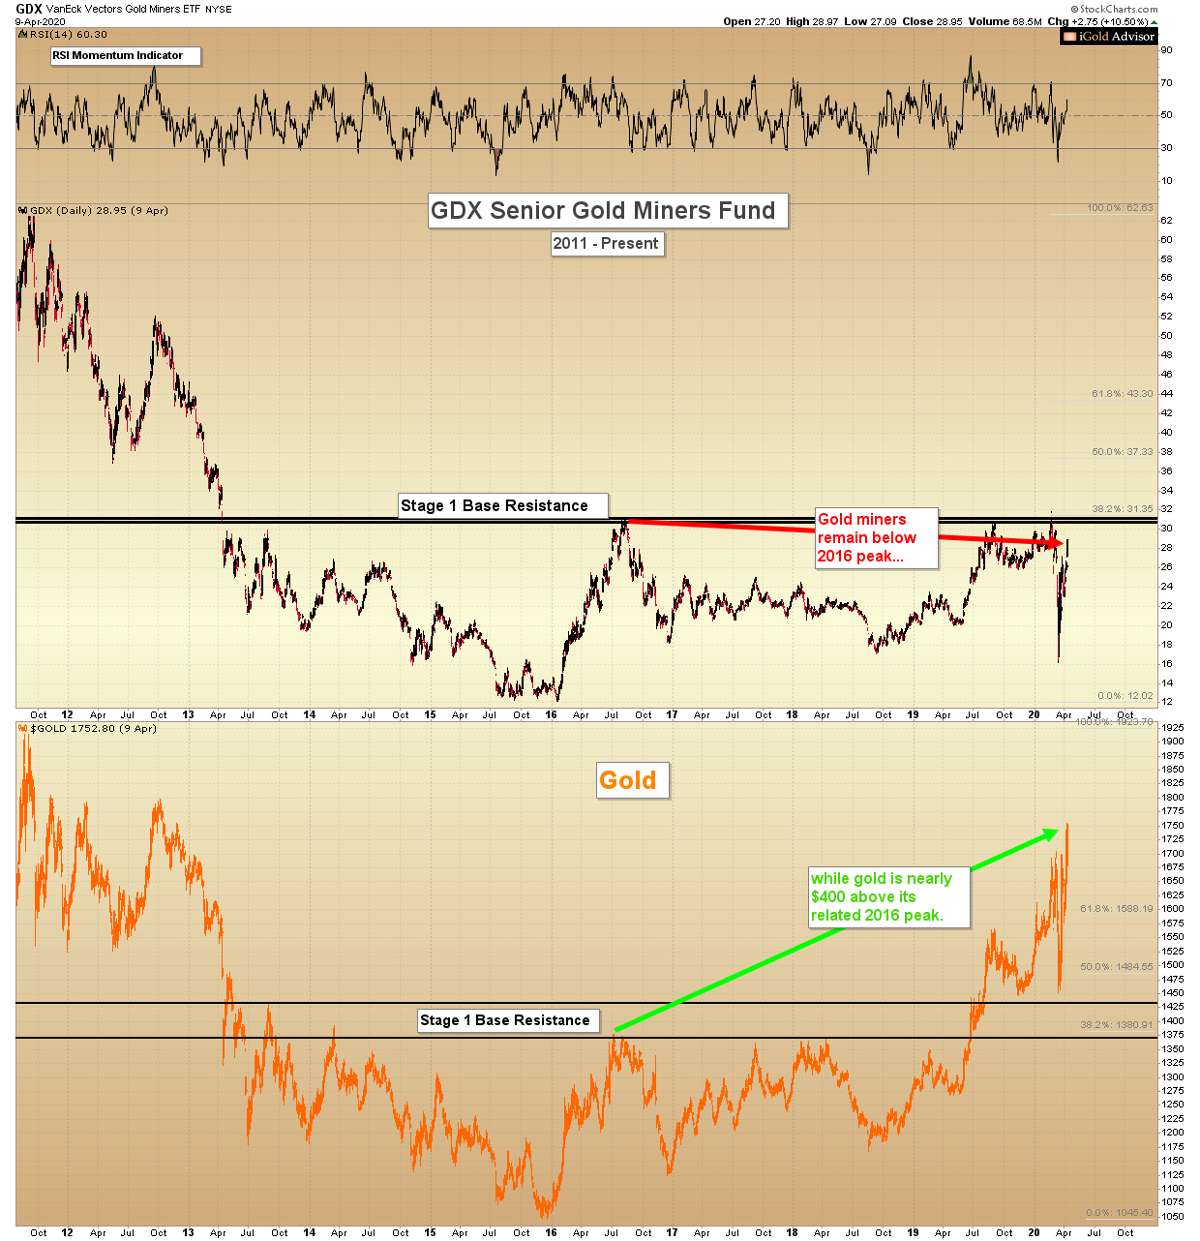
Note that the GDX gold miners fund, which closed the week just below 29.0, remains some 7% below its 2016 peak (red arrow).
Meanwhile, gold itself is nearly $400 above its related 2016 peak (green arrow).
This negative divergence shows that gold mining investors as a sum do not believe the current gold price will last.
What price are the gold miners expecting? Near $1,350, or nearly $400 below the present price.
This is an ominous negative divergence signal for the gold market.
The Last Time This Signal Appeared
Investors may be wondering: when was the last time that the gold mining complex lagged the actual gold price so severely? What impact did previous underperformance periods have on the metals market?
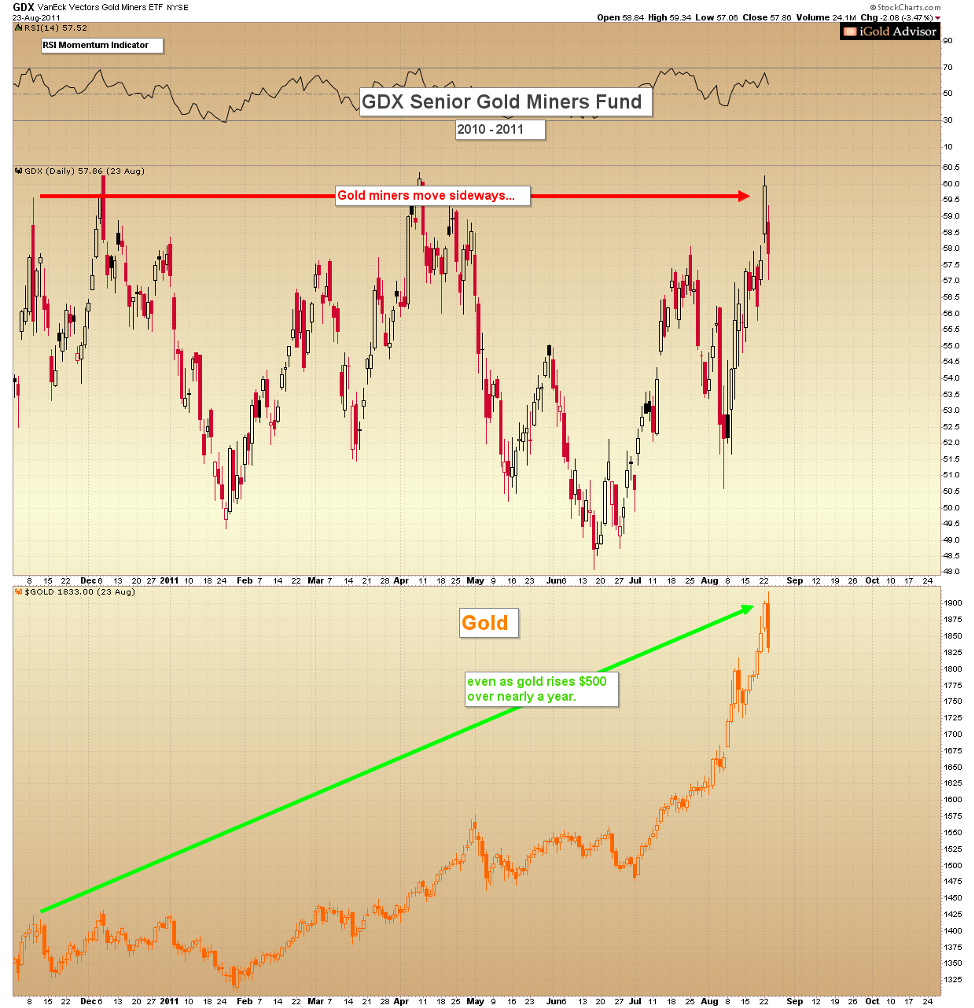
The last time in which the gold miners refused to move higher even as gold advanced was from 2010 – 2011. Let us rewind in our memories to view this period in detail.
Let us rewind back to 2011 to recall what was occurring fundamentally:
- The Federal Reserve was engaged in its second round of QE following the global financial crisis of 2008.
- Global stock and commodity markets had begun to recover from their 2008 – 2009 lows.
- The gold price had risen from $680 in the depths of the financial crisis to over $1,900 by 2011.
- As we see above, throughout the entire 2010 – 2011 final advance in gold from $1,400 to $1,900, the gold mining complex refused to even budge. The miners did not advance even a single point higher even as gold itself advanced by nearly $500 toward its 2011 peak.
What was the result of this massive underperformance in the mining complex from 2010 - 2011? Were gold mining investors correct or incorrect in disbelieving gold’s own advance?
Let us fast forward the above chart for another five years:
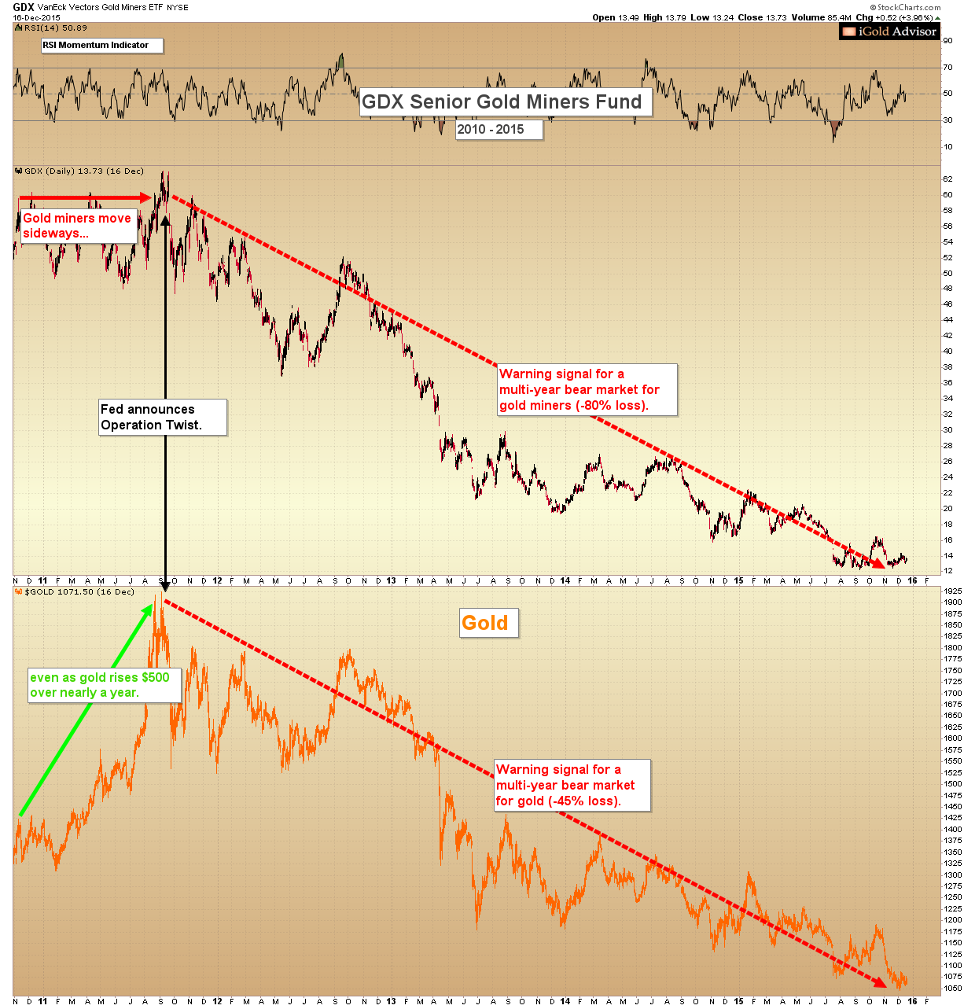
The importance of not ignoring this warning signal from the gold mining complex should be painfully clear:
Gold’s advance was unsustainable. The gold miners were correct in discounting gold’s higher prices. Following the peak, bullion lost nearly $900 per ounce or 45% over the next 4.5 years, while the gold mining complex was decimated, falling 80% over the same period.
Investors should not take this negative divergence signal lightly.
Operation Twist Breaks the Gold Market
Gold peaked in September 2011 at $1,923 per ounce and then declined to $1,045 by December 2015. What was the fundamental trigger that caused sentiment in gold to shift so dramatically from the previous 2008 – 2011 advance?
The answer: the Federal Reserve’s Operation Twist.
We all know the Federal Reserve was engaged in QE to support the economy and large banks following the 2008 financial crisis. This is largely why gold rose so strongly from 2008 through 2011 to above $1,900 per ounce. The gold market was pricing in continued monetary debasement.
Yet on September 21, 2011, the Fed surprised the markets by announcing Operation Twist. Operation Twist represented a change in the Fed’s previous accommodative policies. Instead of continuing to create more money with which to purchase government bonds, in Operation Twist the Fed decided to sell $400 billion in bonds with less than 3 year maturities, and to use those proceeds to purchase an equal amount of bonds with 6 – 30 year maturities.
In other words, the Fed would keep buying bonds, but it would not print more money to do so.
This was a dramatic shift in policy from the 2008 – 2011 period, in which the Fed had expanded its balance sheet (read: created) over $3 trillion to purchase numerous categories of government bonds.
The gold market, which was already pricing in more money creation, was shocked by the change, and collapsed from $1,820 to $1,535 in the four trading days following the announcement of Operation Twist.
Of course, this initial gold drop was only the first of a series of declines which defined the nearly $900 gold bear market which ended in late-2015.
The point: Operation Twist, which signified a change in Federal Reserve policy from more money-creation to relatively less money-creation, is what broke the gold market in 2011.
Gold Miners Saw This Ahead of Time
Very few individuals without insider connections at the Federal Reserve would have known about Operation Twist ahead of time.
Yet the beauty of technical analysis is that we do not need insider connections in order to see the message of the markets.
The gold mining complex as a sum gave us nearly a 1-year early warning signal to gold’s pending top, from late-2010 into mid-2011. Those who heeded this warning were able to sell some of their gold, silver, or mining stocks prior to the vicious 2011 – 2015 bear market.
The exact same signal which appeared at the 2011 top is now appearing again, as gold tries for a second time to climb toward the $1,900 figure.
The only difference is: this time the underperformance in the gold miners is much worse.
At the 2011 peak, the gold miners had been underperforming gold for nearly 11 months.
This time?
They have been underperforming for nearly 45 months, since the July 2016 peak.
This signal is far more ominous than the 2011 one.
What Could Cause a Gold Reversal?
We saw that in 2011, Operation Twist was the direct trigger for gold’s reversal lower and subsequent bear market.
What could be the trigger this time?
Again, we have the gold market pricing in unlimited QE, as announced by the Fed on March 23, due to the Coronavirus.
Is it possible that, once the US economy recovers following the worst of the virus fears, that the Fed will transition to a lesser form of QE again, just as it did in 2011?
If so, gold would have the rug pulled out from under it again, as the market is presently pricing in unlimited QE.
Let us thus watch closely for hints of relative monetary tightening by the Fed over the months ahead as the US economy begins to recover.
Takeaway on Gold
We were bullish on gold in 2015 when nearly everyone was bearish, just prior to the first Federal Reserve interest rate hike in a decade (link: https://www.gold-eagle.com/article/gold-forecast-multi-decade-breakouts-are-rare-and-powerful).
Since then, gold has risen nearly $700 and is on the verge of testing all-time highs.
However, we are now more cautious in our research notes and work with individual clients at www.igoldadvisor.com
The gold market is currently pricing in unlimited QE, similar to the sentiment which existed in 2011.
Meanwhile, gold mining investors are providing us with a familiar warning signal: they do not believe the present gold price will last.
In fact, the gold miners are below where they were in 2016, while gold itself is some $400 above its related 2016 peak.
This is the same negative divergence which was witnessed in 2011 just prior to the Fed’s surprise announcement of Operation Twist.
While we believe that all investors should own a core precious metals position as a “wealth insurance” policy, precious metals investors should be extremely careful at this juncture of chasing recent gold price gains.
A surprise tapering of QE later this year by the Federal Reserve could once again represent the trigger that breaks the gold market.

Christopher Aaron began his career as an intelligence analyst for the CIA and Department of Defense. He served two tours to Afghanistan and Iraq between 2006 - 2009, conducting pattern-of-life mapping for military leaders.
Mapping shares similarities with technical analysis of the financial markets because both involve the interpretation of repeating patterns found in human nature. He is the founder of iGold Advisor, providing independent research and analytics on all aspects of the precious metals markets.
He speaks regularly on the cyclical patterns found within the financial markets and on international policy. He has been featured in the New York Times and NPR news amongst other financial publications.


