Gold Price Forecast: Where Will Gold Bottom?


Gold continues to trade weakly. The precious metal is down $13 for the month of March, $180 thus far in 2021, and some $374 since the all-time high of $2,074 was recorded in the spot market in August of last year.
That said, what is in store for the second quarter of 2021 and beyond?
While we do not have a crystal ball, we can make a high-probability assessment for where gold may bottom based on a study of where large buyers have emerged during recent years.
Gold’s Recent History
To look for high-probability bottom zones for gold, let us study the price action from 2018 through present:
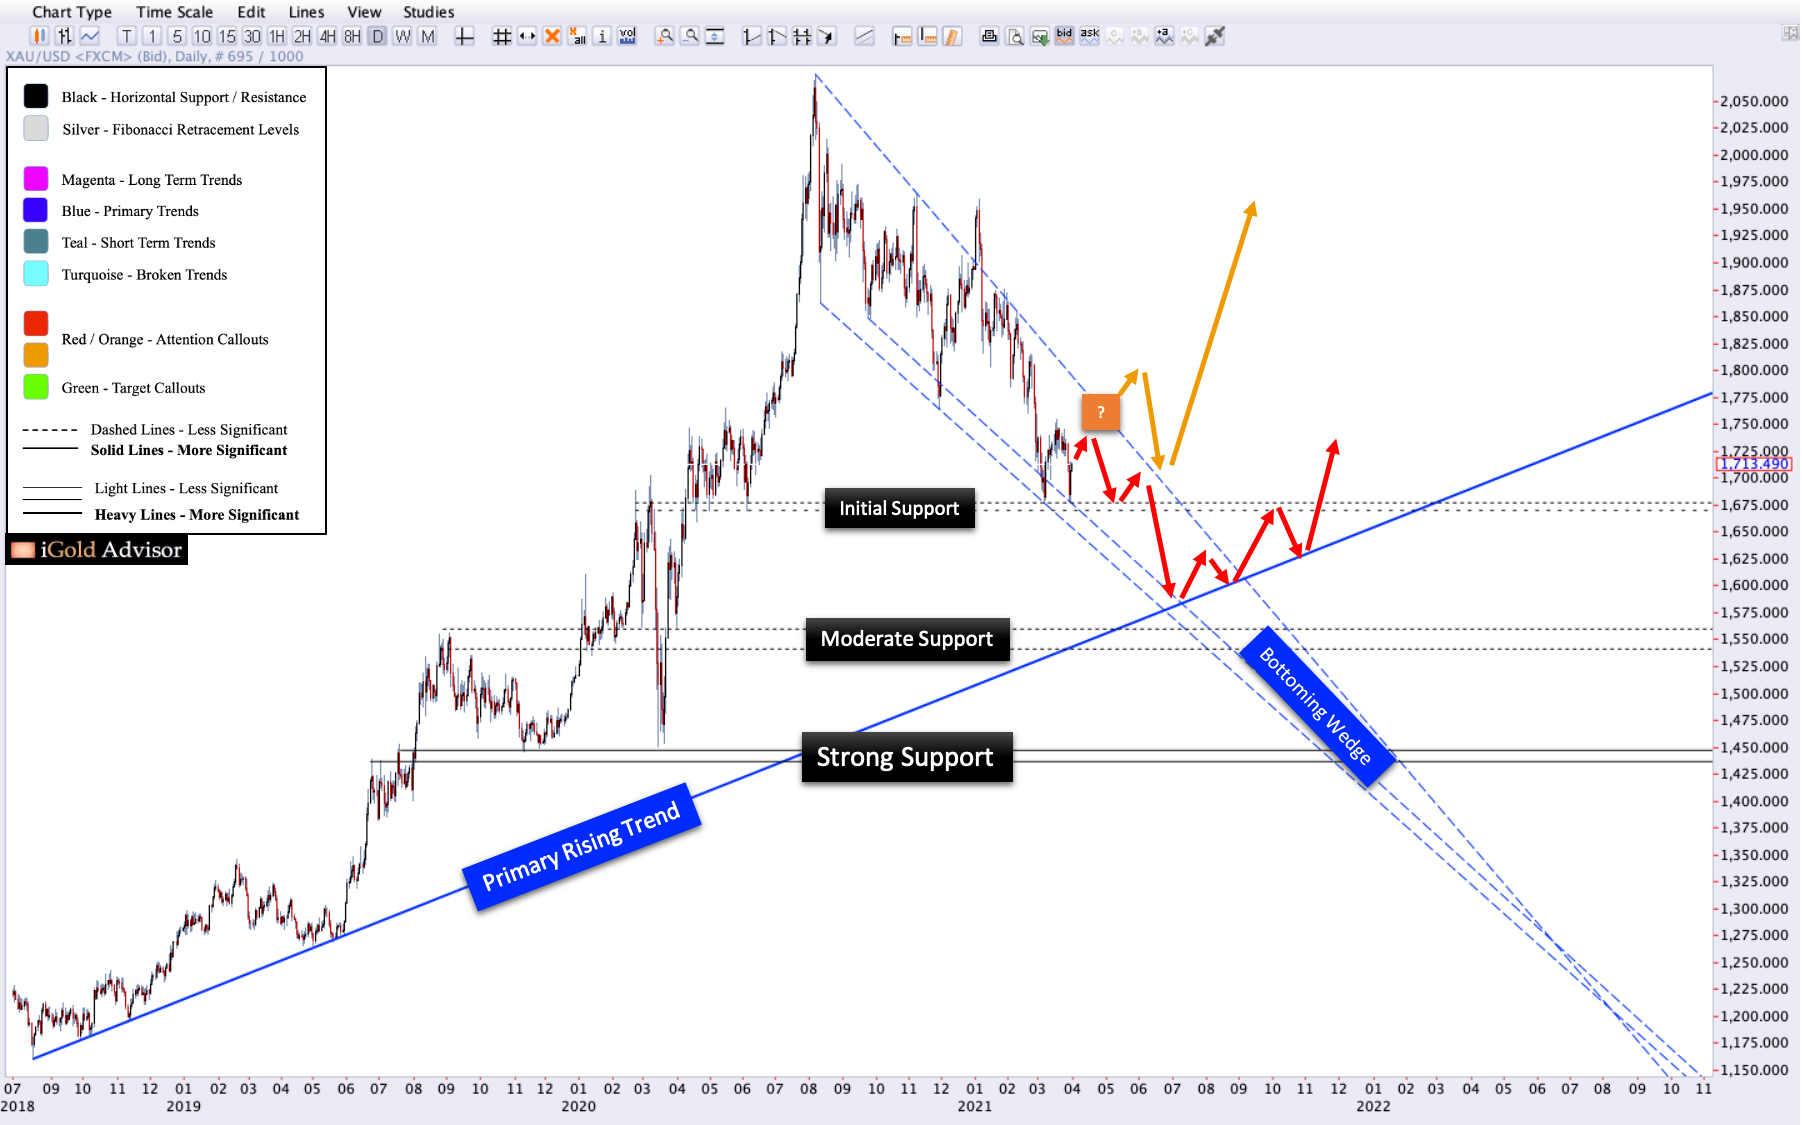
Above we can notice certain critical points:
- The correction which began in August 2020 at $2,074 per ounce has featured a steady series of lower-highs and lower-lows. This overlapping price action is corrective in nature.
- Importantly, gold’s peaks have been declining at a steeper slope than its lows. In other words, buyers are emerging at relatively higher intervals than the sellers. This is a bullish indication. We can see that this converging correction is thus taking the shape of a bottoming wedge (blue), which has an apex in June 2022.
- Gold has a primary rising trend of support (solid blue), which began at the August 2018 bottom of $1,175. Presently, this rising trend should be expected to see buyers emerge at $1,550, a level which is (of course) increasing as time moves on.
- Gold is currently testing initial horizontal support at $1,660 (light black dashed lines).
- Gold has further horizontal support in the $1,540 - $1,560 range (black dashed lines).
- Gold has even stronger horizontal support in the $1,430 - $1,450 range (solid black dashed lines).
In sum, gold is within a clear bottoming wedge pattern, with multiple rising and horizontal support zones that it will encounter along the way on any further correction.
Sign of the Bottom
So, how do we know which one of these support zones will ultimately see buyers emerge again, thus causing gold’s final bottom from the 2020 through present correction?
The signal we should be watching for is for a new higher-high to form, thus breaking the series of lower-highs which began last August.
As the last peak in March occurred at $1,755 per ounce, any weekly close above this figure will be our signal that the low is in place for the correction. This potential bottom scenario is shown above in the orange color.
What if Gold Fails?
What if gold fails to register a higher-high now, and instead rolls over and begins to decline again?
We would then look for gold to decline toward the next support zones, either in the $1,540 - $1,560 range (red arrows), or should gold fail there, down at the $1,430 - $1,450 support zone.
Gold should remain within the bottoming wedge formation during this entire correction.
Takeaway on Gold
The key signal we are looking for to signal a bottom for gold is a break in the series of lower-highs which has formed since last year.
The figure to watch for is a weekly close above $1,755 in the spot market. Such was the recent peak on March 18.
Following a potential new higher-high, we would look for a breaking of the wedge formation at $1,810, followed by a retracement to retest the breakout, followed by a continuation advance back toward the August 2020 all-time high.
Barring a new higher-high, investors should be careful for new lows to come in the gold price into late-2021 and 2022.
The prudent course of action is thus to maintain some exposure to the gold sector now, and to increase exposure on a positive confirmation of a higher-high. At www.iGoldAdvisor.com, we are positioning research subscribers and individual clients for the scenarios outlined in this article.
********

Christopher Aaron began his career as an intelligence analyst for the CIA and Department of Defense. He served two tours to Afghanistan and Iraq between 2006 - 2009, conducting pattern-of-life mapping for military leaders.
Mapping shares similarities with technical analysis of the financial markets because both involve the interpretation of repeating patterns found in human nature. He is the founder of iGold Advisor, providing independent research and analytics on all aspects of the precious metals markets.
He speaks regularly on the cyclical patterns found within the financial markets and on international policy. He has been featured in the New York Times and NPR news amongst other financial publications.


