Gold Price Good News And Bad News


Sometimes, we think that every story in the gold community has the same template:
- I have inside information to share with you
- My peeps are telling me that <XYZ> will happen
- If <XYZ> happens, then the gold price will go ballistic
- (<XYZ> will happen, I just know it)
- So buy gold now, to front-run <XYZ>
- If you, you will make lots of money
- (Money is not gold, but dollars)
- Unless The Dark Cabal acts in their old nefarious ways
- If The Dark Cabal does, then don’t blame us
- Like the last time we predicted $200 silver or $30,000 gold
We read articles this week, reporting that China is considering additional limits on importing gold that the premium for gold in China hit a 3-year high, and imports into China fell in the month of October. At the same time, imports to India rose moderately in October, and of course there are rumors India will ban gold imports too.
Based on the above, should you lever up $6,600 in capital to bet on the price movement of $118,000 worth of gold? Or go bigger, lever up $66,000 to bet on over a million bucks of gold? If so, should you bet on a rising price—or falling?
We respectfully suggest that there is no information content in the import numbers (much less rumors of future political decisions). Zero. You cannot use them to predict the next price move.
In the same way that you could not predict either the US election, or the impact of the Trump victory on the gold price.
You can’t get there from here.
Why not? It’s because the gold market is huge. It’s even bigger than that. Virtually all of the gold ever mined in 5,000 years of human history is still in human hands. And all of that gold is potential supply at the right price and under the right conditions. There are billions of people on the planet, each of whom represents potential demand for gold with the right price and conditions.
Even if the gold import numbers are accurate—a big if—they tell us nothing about global conditions of supply and demand. At best, import numbers tell us that some little piece of the total gold stocks is moving from one corner of the market to another. This is obviously of keen interest to refiners, logistics companies, vaults, and others who stand to gain or lose revenues when gold moves around.
But it is not a signal that can predict price.
If you want to predict the price, you need to see a complete and integrated picture of supply and demand for physical metal. Then calculate the price at which it would clear, if the aforementioned leveraged speculators were not manic (as in silver) or depressive (as in gold). You would have the Monetary Metals fundamental price.
This week was shortened due to the holiday of Thanksgiving in the US.
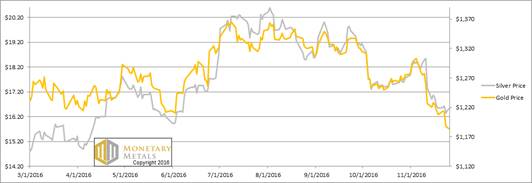
The price of gold fell $24. The price of silver went sideways, though with some volatility that took it near 16 bucks even. It seems there’s a rumor to be started here. If the Chinese and the Indians can’t buy gold, they will turn to silver and we will see the gold price languish while silver goes to $50—which will be a gold-silver ratio of 24:1! (warning: this is just for humor.)
So, really, where to from here?
We will update the pictures of the gold and silver fundamentals below. But first, here’s the graph of the metals’ prices.
The Prices of Gold and Silver
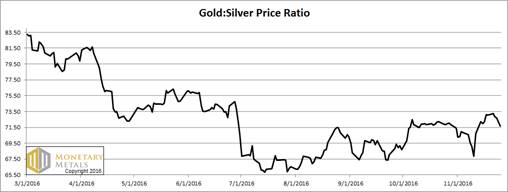
Next, this is a graph of the gold price measured in silver, otherwise known as the gold to silver ratio. It fell a bit this week.
The Ratio of the Gold Price to the Silver Price
For each metal, we will look at a graph of the basis and cobasis overlaid with the price of the dollar in terms of the respective metal. It will make it easier to provide brief commentary. The dollar will be represented in green, the basis in blue and cobasis in red.
Here is the gold graph.
The Gold Basis and Cobasis and the Dollar Price
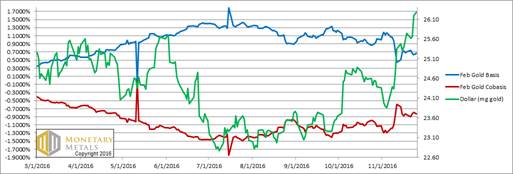
For both gold and silver, we moved to the next contract (February and March, respectively) as the December contract was getting too close to expiry.
Bad news for gold speculators. Along with the falling price (on this graph, depicted as a rising price of the dollar, the objective view of what’s happening) we have a basis and cobasis that went sideways.
Gold did not become more scarce when its price dropped $24. So the fundamental price dropped more than the market price. It’s still twenty-five bucks above the market, but that’s a slim margin for error.
Now let’s look at silver.
The Silver Basis and Cobasis and the Dollar Price
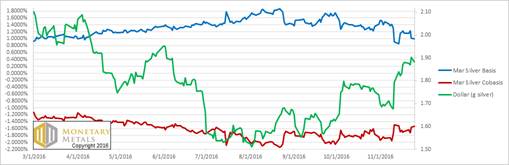
In silver, there is a somewhat different picture. Price is unchanged, but there is a falling basis and rising cobasis. The fundamental price of silver is up 40 cents.
So for silver speculators, we have a good news, bad news scenario. Good news: the fundamental price is up 40 cents. The bad news, it’s still $1.65 under the market price.
We frequently (well nearly every month) talk about shifting our graph from an expiring contract to a farther contract. So let’s look at a graph showing only the bases for the Dec and March silver contracts. We have depicted the spread between the two bases in grey.
The Basis for Dec and March Silver
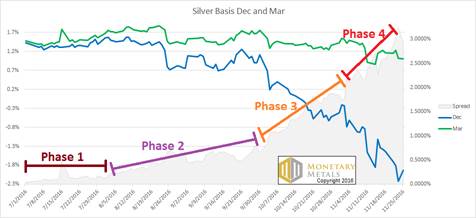
What’s happening here is that when the December contract is far out in time, its basis tracks closely with that of the March contract. This is Phase 1.
Then, around the beginning of August, it begins to deviate. There are three distinct effects causing the Dec basis to fall away from March.
The first is time preference, which appears in Phase 2. Think of carrying silver—buying metal and selling a future—as an investment. It has a yield, comparable to any other investment. The longer you have to lock up your money, the higher annualized yield you demand. On July 1 (the start of the graph), the Dec contract has 6 months to expiry. The Mar contract has 9 months. There is not much difference between a 6- and 9-month investment. But by August, December is approaching on the horizon, and the difference between a 5-month and 8-month investment is more significant. By September 30, the Dec contract now only has 3 months remaining whereas Mar has 6 months. Time preference increasingly favors the Dec contract, hence its lower yield as more market participants prefer it to the March maturity.
By the end of September, we enter a steeper region, Phase 3. At this point, naked longs—those who buy futures on leverage, without the cash to take delivery—may not be selling yet. However, for new positions the next contract is preferred as it has more time before expiration.
And Phase 4 starts around the beginning of November. By this point, naked longs are forced to sell Dec (if they want to hold their metal trades open, they can buy March).
Anyways, as each contract nears, the basis tends to fall. This propensity is noise, not signal (and it helps prove that there is not a large naked short position—if there were, the basis would tend to rise).
© 2016 Monetary Metals
 Dr. Keith Weiner is the CEO of Monetary Metals and the president of the Gold Standard Institute USA. Keith is a leading authority in the areas of gold, money, and credit and has made important contributions to the development of trading techniques founded upon the analysis of bid-ask spreads. Keith is a sought after speaker and regularly writes on economics. He is an Objectivist, and has his PhD from the New Austrian School of Economics. His website is www.monetary-metals.com.


