Gold Price & Miners Are Ready To Rally


 The ADP employment numbers released Wednesday were weak indicating a slowing in the economy, and commodities rallied under the assumption that the Fed will delay rate hikes. Friday the Non-farm payroll numbers came in at only 126,000 jobs versus the expected 245,000, the smallest increase since December 2013. Markets weren’t open Friday due to the Holiday but I imagine if they were commodities would have rallied strongly.
With the quarter ending let’s review where we stand in the big picture, I still see three possible scenarios.
1. Gold bottomed at $1,130, and the correction is over (least likely in my opinion)
2. Gold will roll over breaking $1,130 bottoming later in 2015
3. Gold remains range-bound during 2015, bottoming in the fall of 2016 around the US elections
Gold Quarterly Chart
We began the 26th quarter of this MAJOR cycle a few days ago, and the limited data is showing a 32 quarter average between cycle bottoms. The 10-Quarter moving average is currently at $1,277, if we get a solid close above that level I will lean more towards scenario 1 “the correction is over”. Remember, the close is what is important, and a lot can happen between now and the end of June.

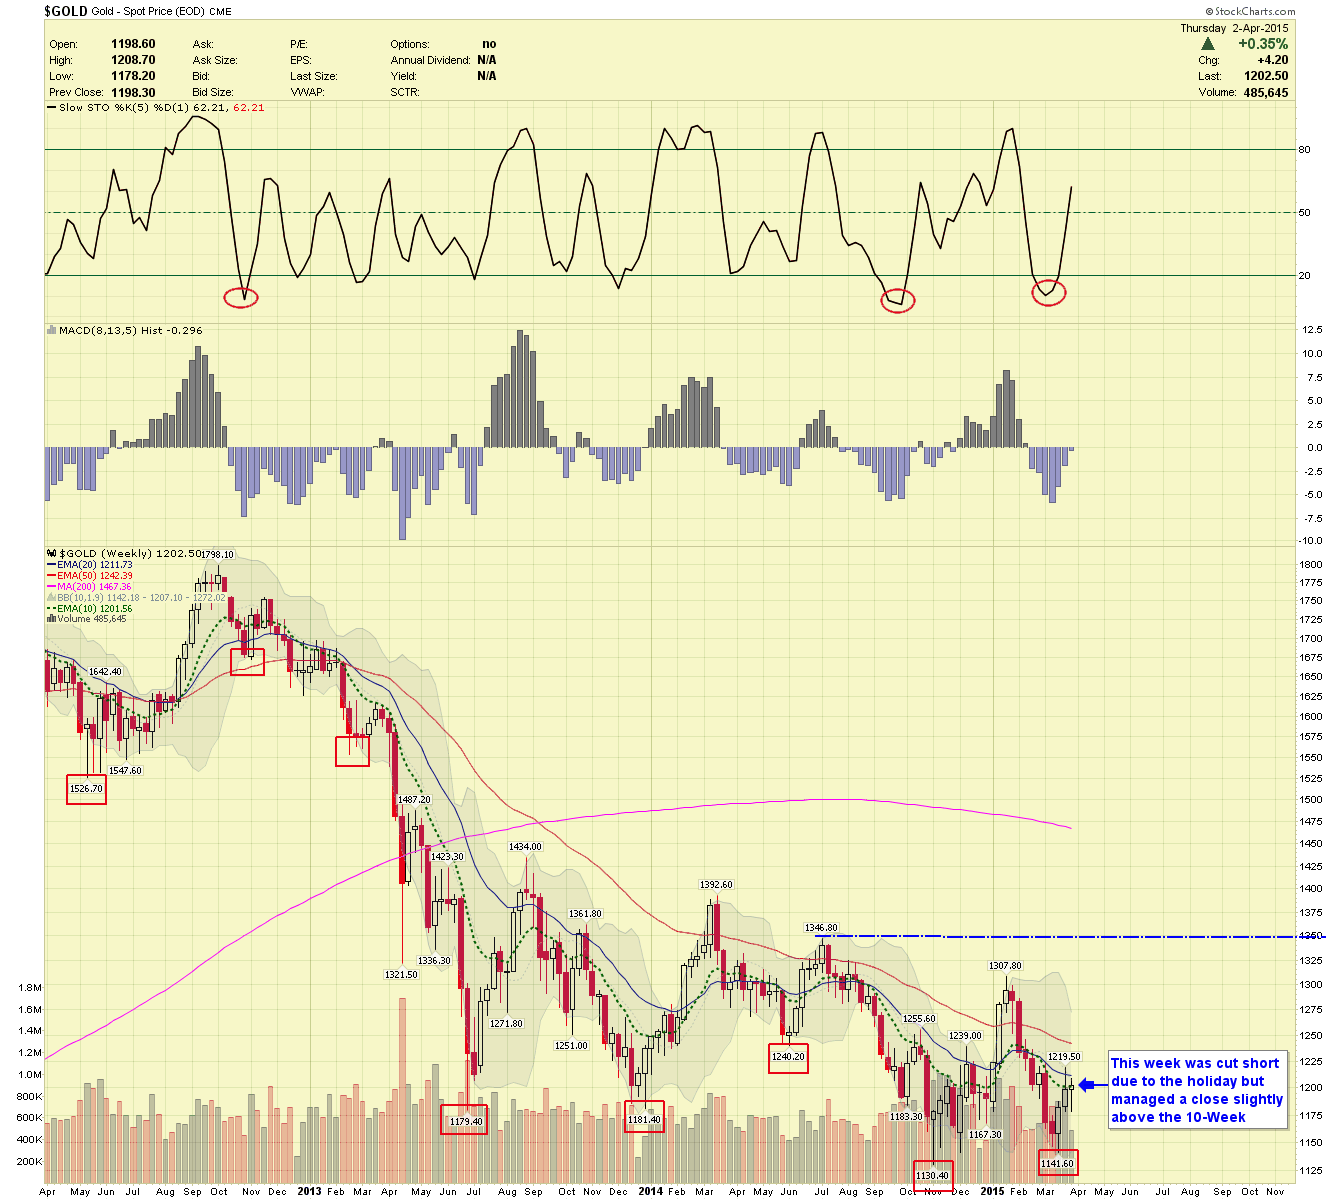
Gold Weekly Chart
Gold price managed to close ever so slightly above the 10-Week moving average, I imagine if the week weren't cut short we would have had a much stronger close. If I’m correct in the US dollar cycle analysis (last chart), commodities could rally sharply between now and Mid-May.
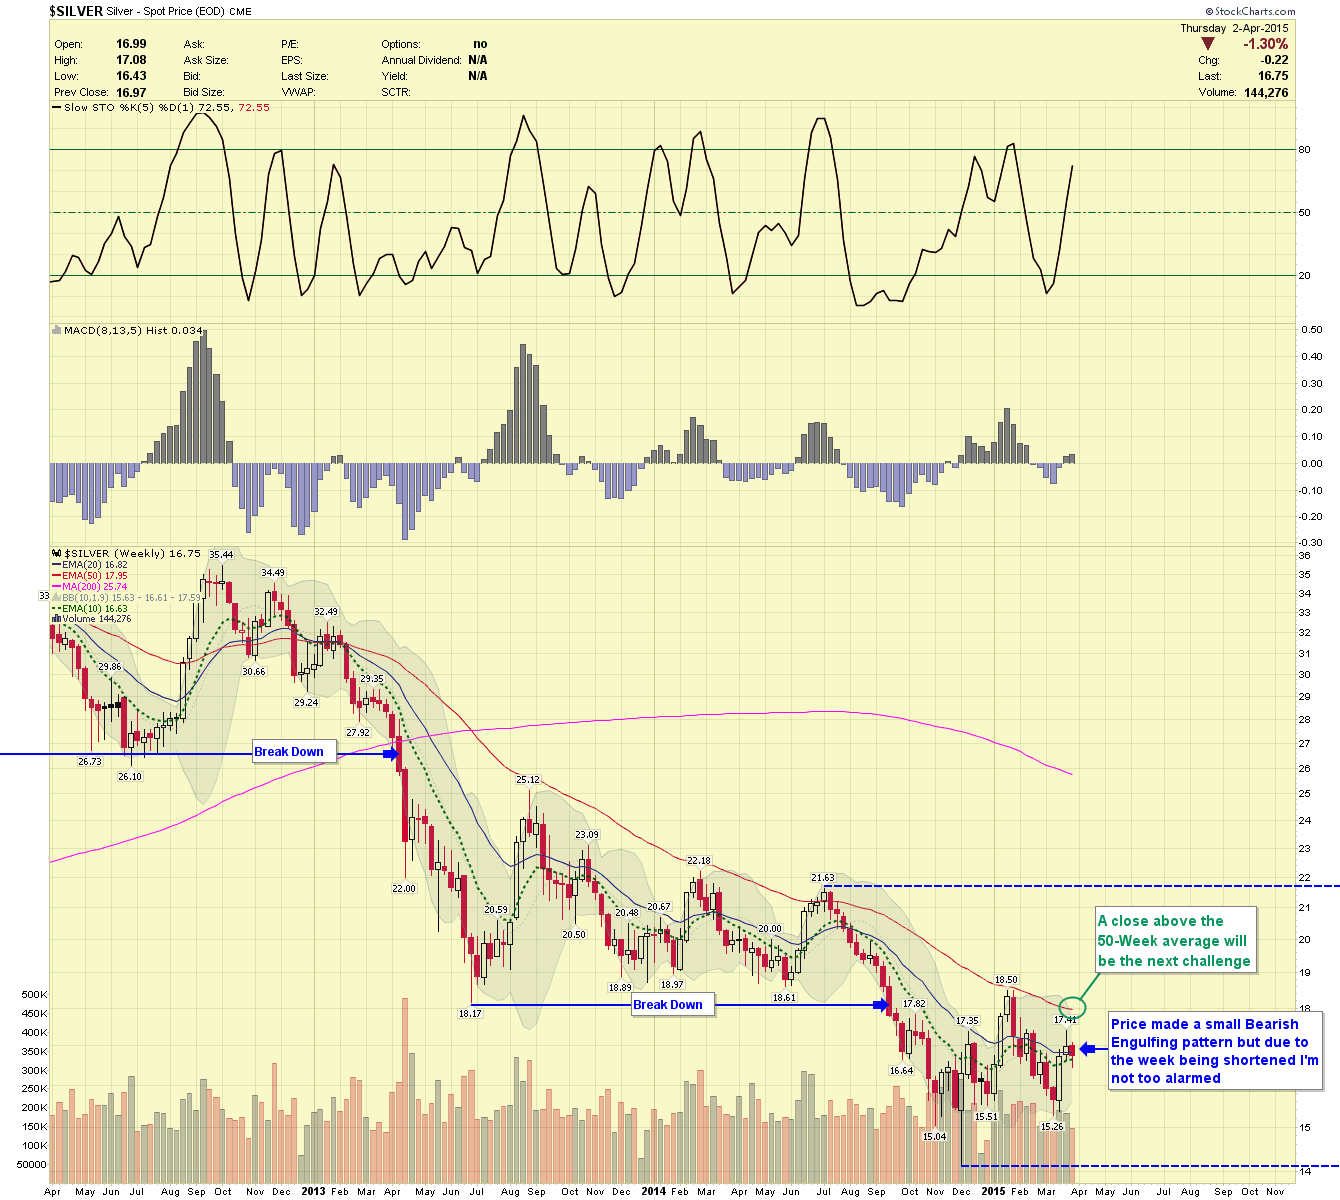
Silver Weekly Chart
Silver price made a small Bearish engulfing pattern this week which would normally be a caution flag, but it holds less weight due to the short trading week. Price should challenge the 50-week average next.
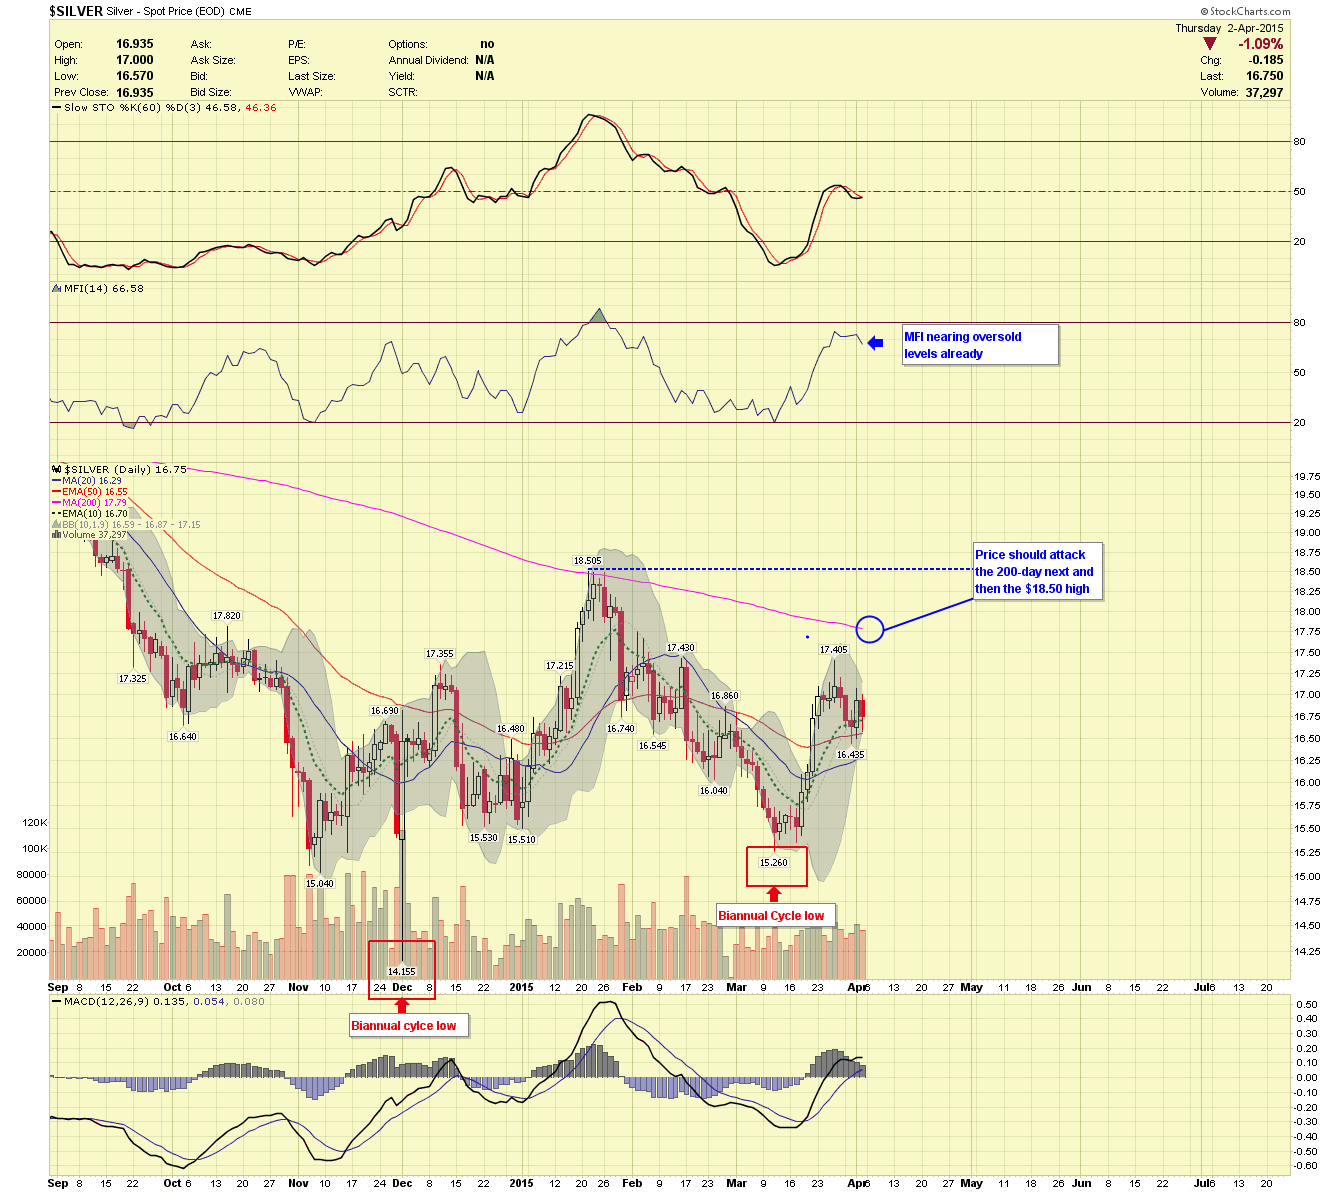
Silver Daily Chart
Silver price should target the 200-day and the previous high of $18.50 next.
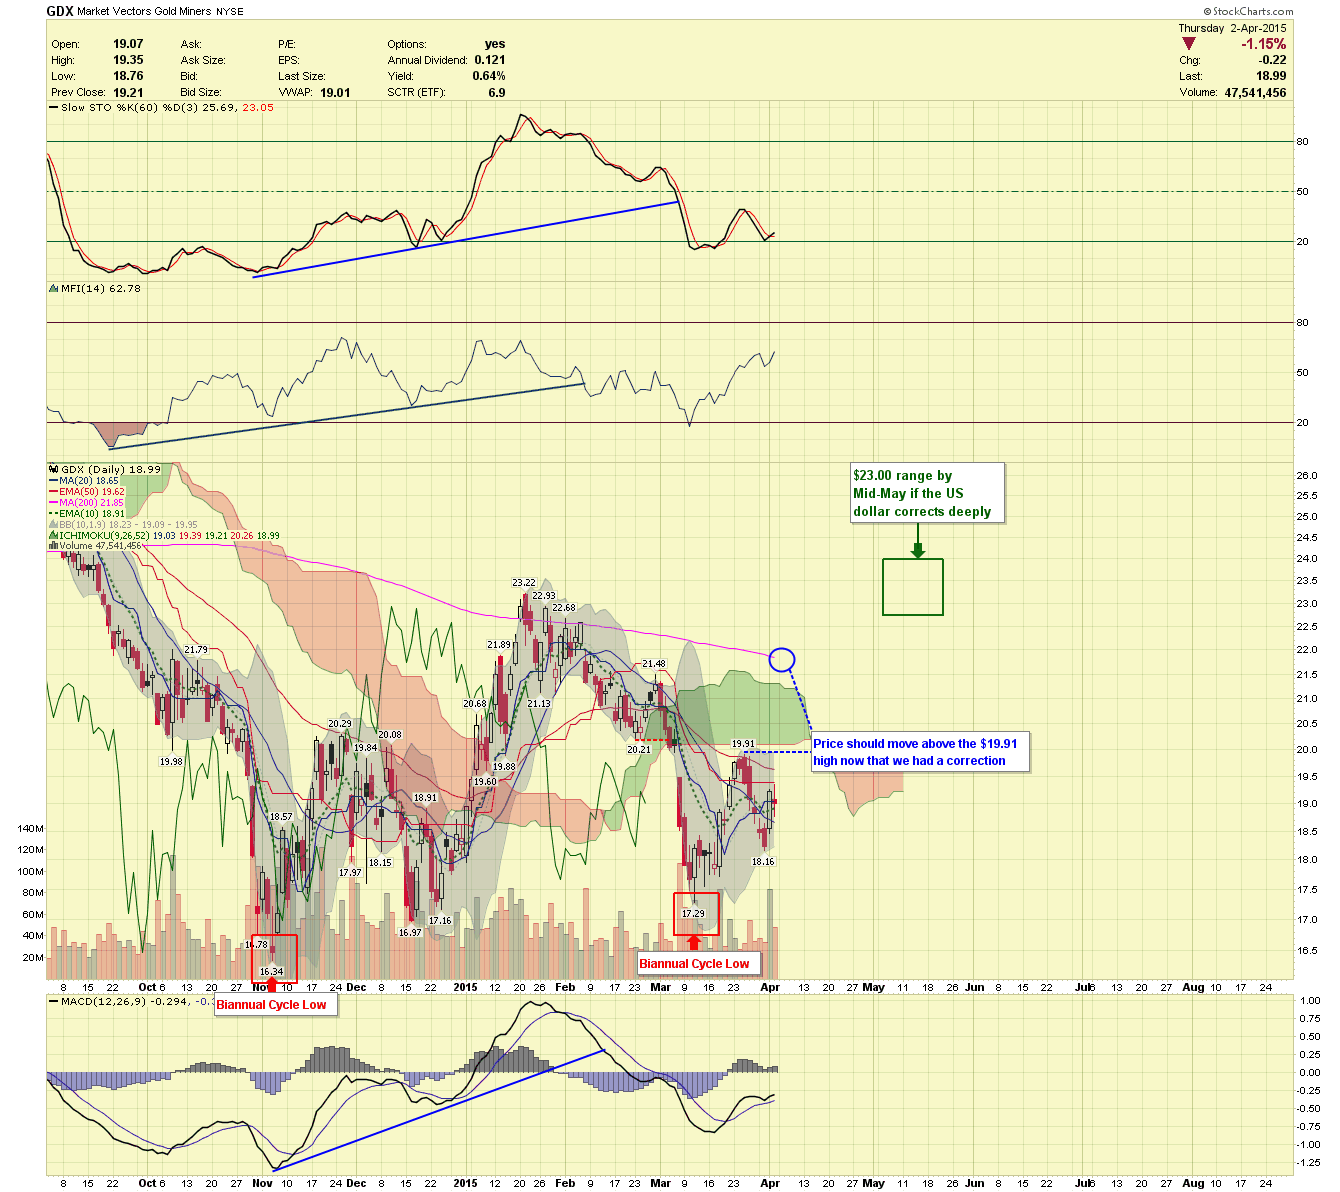
GDX Daily Chart
This chart shows a potential target of $23.00 in the next six weeks, and again this target is likely contingent upon the US Dollar.
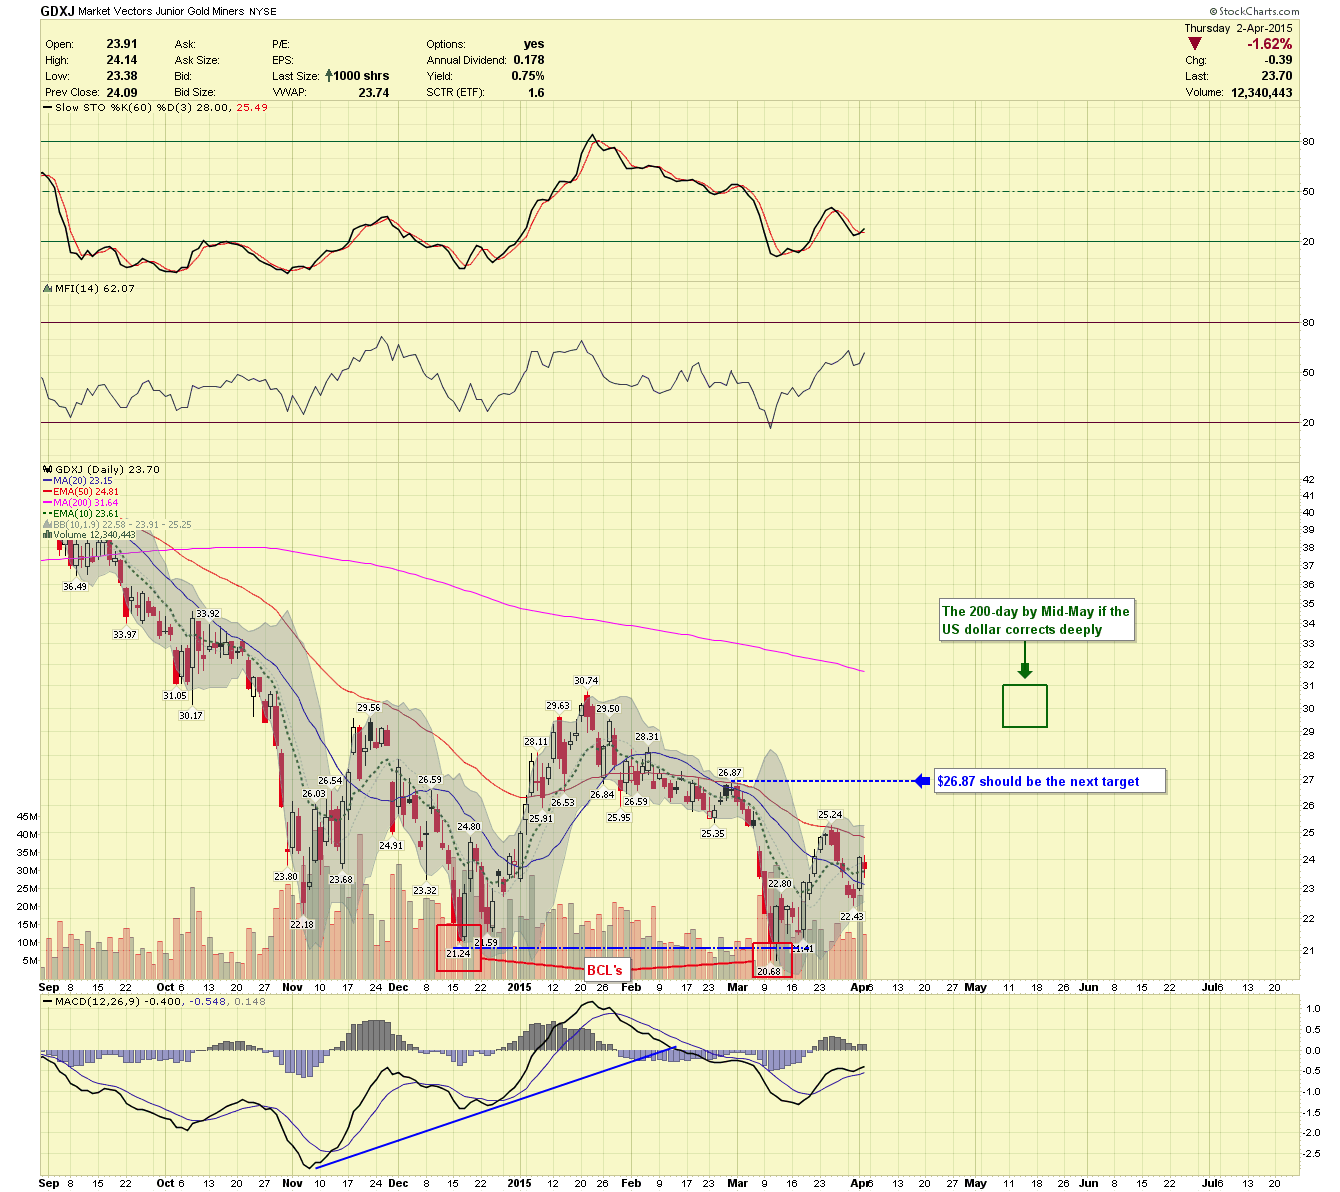
GDXJ Daily Chart
Price should be targeting $26.87 next and could reach as high as $30.00 by mid-May.
US Dollar
I don’t often apply cycle analysis to the US dollar but occasionally I try to find a correlation; there has been a dominate cycle of approximately 36-trading days between cycle bottoms recently. The $96.32 low formed could very well be a cycle low and if taken out price could fall in a left translated manner all the way down to the red box by mid-May. This is just a potential that I currently see; we will watch carefully and know more in the next week or two. If the dollar falls to the levels targeted, commodities should have a nice rally.

The Chartseek Example Portfolios will likely add to positions early next week.
********
Click here for a 50% off special offer: http://www.chartseek.com/services.html
********


