Gold Price Scores Its Largest Gains Since Its All-Time High In 2011
 share
share
 share
share
 share
share
 share
share
 share
share
 Gold's combined gains for the past two weeks (+10.8%), and for the past three weeks (+12.8%), and for the past four weeks (+13.8%) are the largest percentage winners since the week ending 19 August 2011, after which price proceeded upward to its All-Time Closing High (of 1900 on 22 August 2011) and then further to its All-Time Intraday High (of 1923 on 06 September 2011). Gold's gain for this past week alone (+5.5%) was bettered since those All-Time Highs just once (for the week ending 28 October 2011). Did you hear any of this on Top of the Hour news broadcasts? No. 'Tis not a relevant issue given Gold's having been both declared -- and discarded as -- a relic.
Regular readers realize that our documented targeted high for Gold here in 2016 is 1280. So from 2015's closing level of 1061, that allows for a year's-worth of 252 trading days to rise by as much as 21% -- or 219 points -- clearly an improbable feat for a once-esteemed Precious Metal that has become all but a laughable sideshow in a one-world currency bent on bitcoin. And yet come this past Thursday, just 28 trading days into the year, Gold found itself already up as much as 19% -- or 202 points -- to 1263, in turn making our 2016 goal of 1280 now seem rather puny.
'Course, regular readers also realize that, in trading as high as 1263, Gold found itself clearly within the confines of the notorious purple-bounded 1240-1280 resistance zone -- which we've highlighted for many-a-month in our below chart of Gold's weekly bars -- such as to see price not surprisingly be brusquely shoved back down yesterday (Friday) in settling out the week just a point below said zone at 1239:
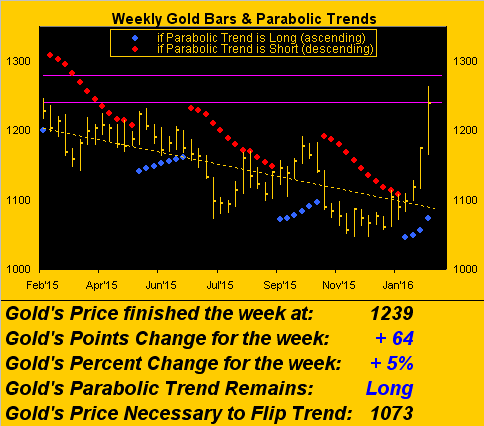
Still, does this mean that the bottom is in? Last week we wrote "it really does feel like it"; this week  "I second that emotion..."--(Smokey Robinson and the Miracles, '67). But in staying true to our defined criteria as to "how we'll know when the bottom is in", we've but one category (the fourth as follows) left to achieve:
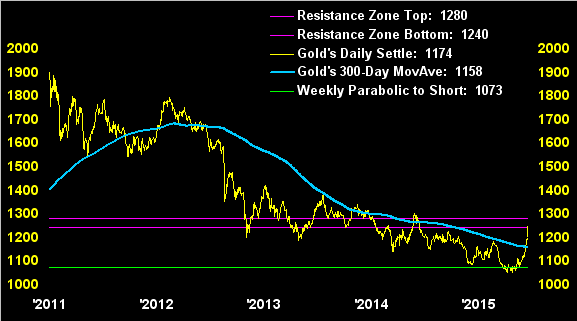
■ The weekly parabolic trend ought be Long ('tis)
■ Price ought be above the 300-day moving average ('tis)
■ The 300-day moving average itself ought be rising ('tis)
■ Price ought trade at least one full week clear above 1280 (hasn't)
And what really ought catch your eye is the state of the third category in the above stack. That's right folks: the 300-day moving average itself turned higher this week for the first time since a brief stint of so doing in early March of last year. However, should Gold succumb and pull back a bit through here, the average's direction is sufficiently fragile such that it could easily bend back down. But at least for the moment, again we've the feel that Gold is close to sealing its bottom deal. Here's the graphic view of the criteria across Gold's daily settles from its All-Time Closing High-to-date:
"That looks almost straight up, mmb..."
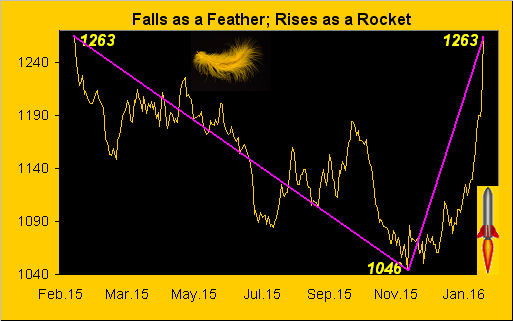
Oh hullo, Squire: back from the Super Bowl, I see? The only thing worse than the game (and my call for a blowout by Carolina), was the tasteless half-time show ... and spare us the details of your ostensibly being involved with it: 'twas an embarrassment. Anyway, dust off those Fool's Gold confetti flecks and pay attention, for you've brought up a salient point: we've on occasion stated that Gold -- unlike other markets -- seemingly has a hankering to rise more swiftly than does it fall. To wit:
Until this past Thursday, Gold had not seen the 1263 level since just over one year ago on 06 February 2015. From that date, it took Gold 208 trading days to reach as low as 1046 this past 03 December. The return to regaining 1263 on Thursday took a mere 47 trading days, i.e. the trip back up was more than four times as fast as the fall. Here 'tis graphically:
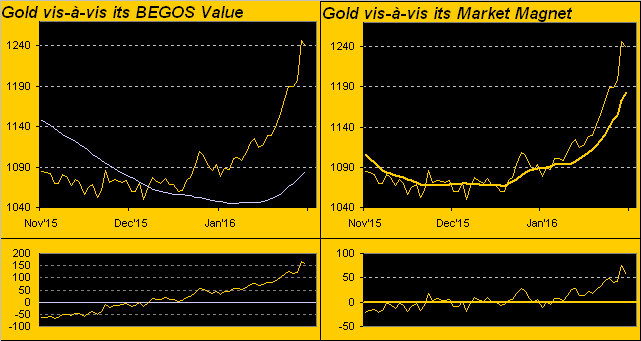
Now: all that said, we've this from the "Problem We Love To Have Dept." In both last week's missive as well as in recent daily Prescient Commentaries at the website, we've cautioned that Gold per near-term comparative measures has now really wandered way off course, and delightfully so to the upside. The supportive Good News impetus for this is that finally the world is waking up to the ongoing facts of slowing economic growth, earnings-lacking equities levels, declining confidence across the bow-wow currencies, and escalating egregious amounts of debt, a material portion of the newer junk demanding negative rates of interest. That's right folks: you now have to glue those perforated coupons back onto the bond certificates! Who knew? The point is: with Gold now making up for a lot of lost time in getting with its mitigative role against the worthlessness that 'tis all 'round, price is at near-term extremes in two key measures which we track regularly (as updated daily at the website). Here they both are in the following two-panel display of Gold over the past three months-to-date. On the left is price vis-à-vis its BEGOS (Bond / Euro / Gold / Oil / S&P 500) value, essentially a regression (the smooth pearly line) of Gold's movements to those of the other four components; the +150 reading in the oscillator (price less value) at the panel's foot is the most extreme since Gold's All-Time High in 2011. On the right is a similar, albeit "faster", tracking of price vis-à-vis its Market Magnet, which is a 10-day moving average that is weighted per the amount of contract volume traded at each price point; exceeding 50 points away from the Magnet, as we see in that respective oscillator, is way out-of-bounds. But we're lovin' it:
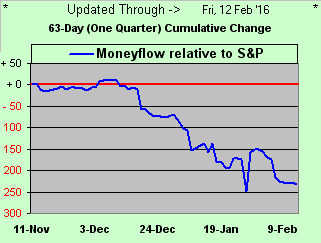
What's not gettin' "Good Lovin'"--(The Young Rascals, '66), and rightly so, is the stock market. And despite the dead kitties that go bouncing about, the underlying moneyflow of the S&P 500 remains nothing short of ghastly, (unless of course you've been Short). From the website's "S&P 500 -- Moneyflow" page, here is the difference between the present level of the S&P (1865) and where its quarterly Moneyflow (regressed into S&P points) suggests it ought be right now: 233 points lower (at 1632) ... which makes sense given our 2016 low target for the low 1400s:
Indeed alluding to the word "finally" two paragraphs prior, we're also finally seeing the S&P walk more hand-in-hand with the Economic Barometer as it had done for so many years save for those most recent. Why even the Trumpster himself this past week with respect to market valuation likened it to "a big, fat, juicy bubble":
Speaking of bubbles, 'tis good to see the science of mathematics at work. Recall when the S&P was in Loony Land north of 2000, such that we were calculating ridiculous levels of the Index's price/earnings ratio well up into the 40s, whilst reminiscent of our B-school days wherein we we're taught that levels exceeding 15x bordered on being expensive? Now having had a bit of a haircut, (the S&P presently -13% from its highest ever reading of 2134 on 20 May 2015), our "live" p/e is presently 35.7x. 'Course, halve that toward getting the S&P down to a reasonable valuation would give us 1865 ÷ 2 = 933 ... which would not be all that bad considering we got into the 666 handle in the 2009 wake of The Black Swan.
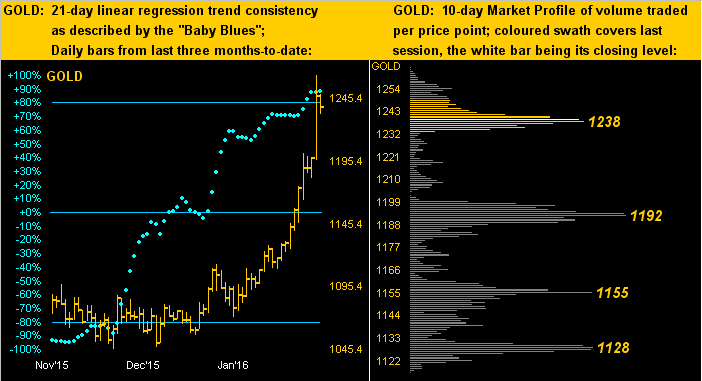
From secondary market paper to hard asset substance: our next two-panel graphic features on the left Gold's daily bars for the past three months along with the baby blue dots which depict the day-by-day consistency of the 21-day linear regression trend; on the right is Gold's 10-day Market Profile:
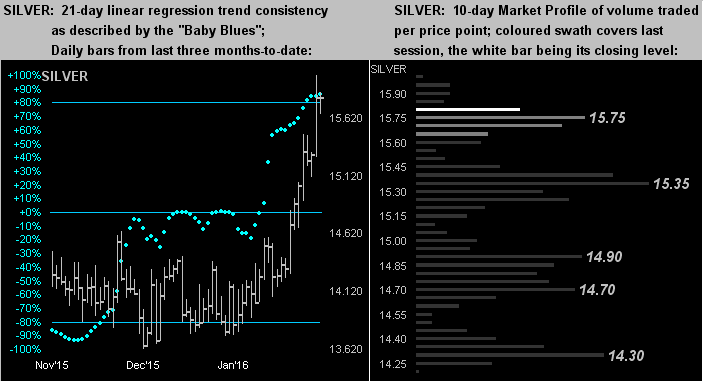
And make no mistake about it out there: with Copper groanin' and moanin' alongside Oil and the S&P, Sister Silver has thrown off her industrial metal jacket, to now appear resplendent in her precious metal pinstripes. Here she is with her Baby Blues on the left and Market Profile on the right ... Sweet!:
As to our mention of Oil (the West Texas Intermediate variety presently priced at 29.02, which from its highest ever level of 147.27 on 15 July 2008 is -79.9%), the following "alphateers" headline from yesterday -- "Latest Oil Rally Another 'False Dawn' As Global Supply Glut Worsens" -- put us in mind of our high-level economics course taken in the final year of college back in 1976. I shan't likely forget the professor's then putting forth that in 20 year's time (i.e. by 1996), the world will have run dry of Oil.
In fact, let's take a quick spin 'round the world. We read this past week of Germany and France looking to right long-standing flaws in the €uro through more economic integration and authoritarian measures. Oh I'm sure the PIIGS are gonna love that! (Pssst: can you say "bifurcation"? Just a thought). Moreover, Q4 GDP EuroZone growth being only +0.3% is fueling cases for more monetary accommodation. On to Japan, their 10-year bond yield just hit 0.000%. (Sweden, whilst further negative on the short end, still yields 0.465% for a decade's holding; as for StateSide 10-year T-Dough? 1.748%).
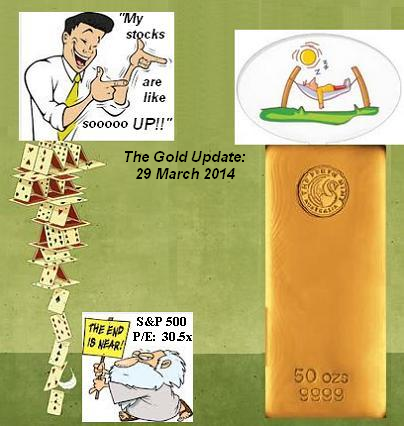
And thus 'round back to the USA, and specifically to here in San Francisco, where worries now are over high real estate levels such as they were just prior to the Dot Bomb of 2000-2002. I've executive friends at both LinkedIn and GoPro who in the past two weeks have both wailed "oh-NO!", their equities from last year's highs respectively off -63% and -90%. (We note as well that bitcoin is off -65% from its highest-ever level). It all brings to mind this graphic from not quite two years ago in the 29 March 2014 edition of The Gold Update, (at which writing Gold was 1294 and the S&P 1857, both levels ironically close to those of today, despite all the furtherance of monetary debasing and even less supporting earnings in the interim):
StateSide, the physical exchanges are shut Monday in honor of our 44 Presidents-to-date, however the markets representative of our BEGOS complex and others will be up and running on GLOBEX as usual starting tomorrow (Sunday, 15:00 PT), save for a celebratory trading halt (Monday 10:00 PT - 15:00 PT). But the shortened week shan't be without key incoming Econ Data for the Econ Baro on regional manufacturing, inflation, and housing, the highlight of the stint being the Federal Open Market Committee meeting minutes from their 26-27 January pow-wow."Bow-Wow!" Mind your Gold, and don't be put back by a near-term setback for the trend by many-a-measure is turning UP!
share
share
share
share
share

Mark Mead Baillie has had an extensive business career beginning in banking and financial services for two years with Banque Nationale de Paris to corporate research for three years at Barclays Bank and then for six years as an analyst and corporate lender with Société Générale.
For the last 22 years he has expanded his financial expertise by creating his own financial services company, de Meadville International, which comprehensively follows his BEGOS complex of markets (Bond/Euro/Gold/Oil/S&P) and the trading of the futures therein. He is recognized within the financial community of demonstrating creative technical skills that surpass industry standards toward making highly informed market assessments and his work is featured in Merrill Lynch Wealth Management client presentations. He has adapted such skills into becoming the popular author each week of the prolific “The Gold Update” and is known in the financial website community as “mmb” and “deMeadville”.
Mr. Baillie holds a BS in Business from the University of Southern California and an MBA in Finance from Golden Gate University.


