Gold Price To Silver Price Ratio: So What?


Analysts use this ratio to describe how inexpensive silver is compared to gold—like now. They also use the ratio to show long-term buy zones for both metals.
WHY?
Silver prices move up and down farther than gold prices. That pushes the gold-silver ratio too high, like now, when silver is inexpensive. Or it pushes the ratio too low, as in January 1980, when silver prices zoomed upward too far and too fast.
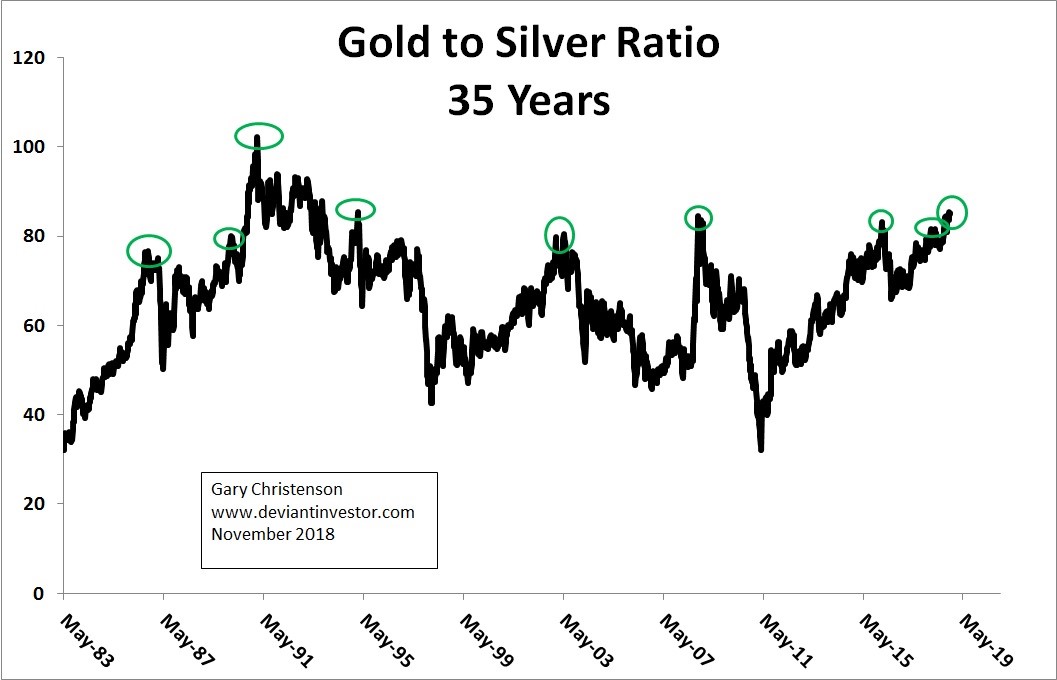
When the gold to silver ratio exceeds 80, it is often a good time to buy silver.
Do the data support this conclusion? Can we quantify this analysis?
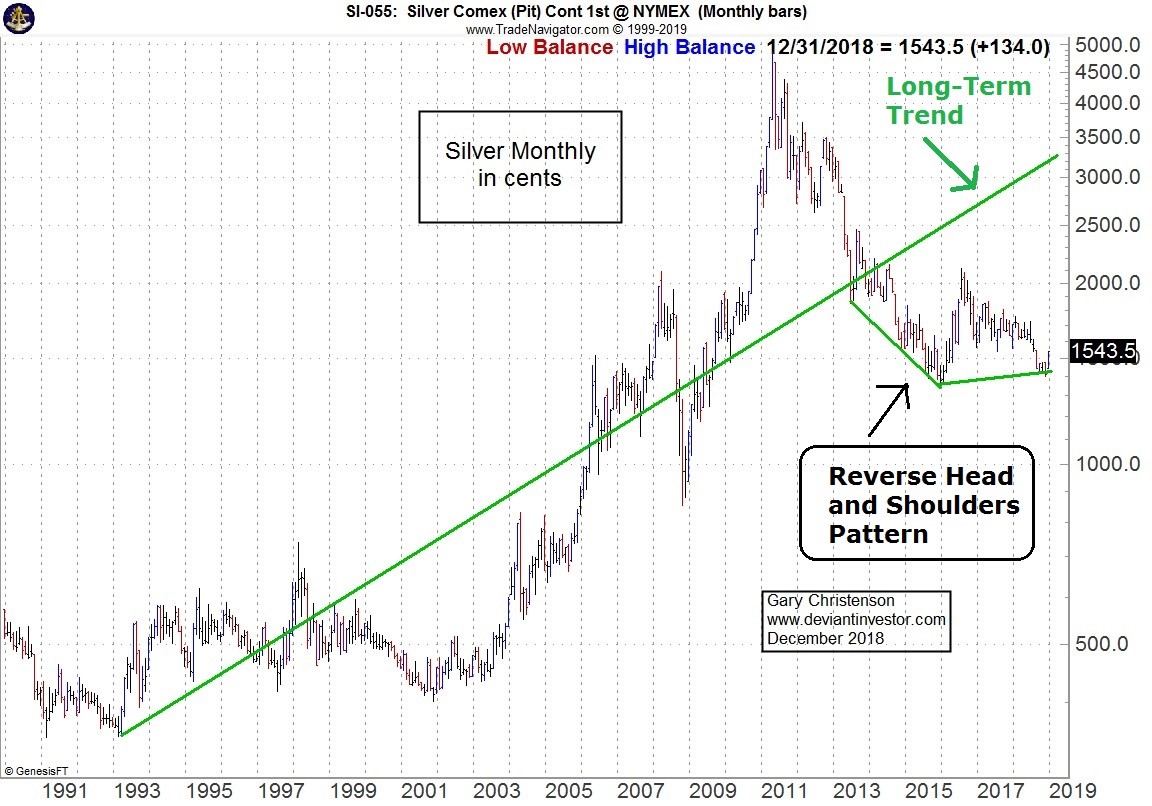
Examine the chart of the ratio (weekly data) for 35 years, starting in 1983 after the early 1980 bubble had partially corrected. Look at the chart of silver prices since 1983. You will notice:
- Silver prices moved higher in a strong bull market after President Nixon severed the link to gold backing the dollar in 1971. Thereafter the dollar “floated” lower as commodities and consumer prices rocketed higher. “Stagflation” reigned.
- Silver prices went crazy in early 1980 and peaked over $50 in a bubble. The paper exchanges modified the rules and forced selling to collapse the bubble. A silver price of $50 per ounce in 1980 is equivalent to $200 – $300 per ounce today if appropriate cost-of-living adjustments are used.
- Silver prices fell, with occasional rallies, for two decades, bottomed in 1991 at $3.51 and again in November 2001 at $4.01.
- Silver prices rose to nearly $50 in April 2011. The powers-that-be worried and smacked the paper prices on COMEX much lower.
- Silver prices fell to $13.61 in December 2015, the apparent end of the nasty correction following the 2011 peak.
Summary: Bull markets from 1971 to 1980, from 2001 to 2008, and 2008 – 2011. Bear markets from 1980 to 2001, and 2011 to late 2015. Flat and a beginning bull market since 2016.
Examine the ratio since 1983. Select the nine peaks based on these rules:
- Ratio exceeds 75 and falls thereafter.
- The ratio peaks must either reach new highs or be the highest in several years.
Examples: Use the peak in February 1990 since it is the highest in over three years. Do not use the 1992 and 1993 peaks because they are lower than the all-time peak of 102 reached in February 1991. Use the peak in November 2018 at 85.47 because it is higher than the April 2018 peak at 81.64.
Using these nine peaks in the gold to silver ratio we calculate the one year, two year, and three year high price gains for silver. We don’t yet know future prices following the 2018 ratio highs.
Summary:
The average one year increase in price from the ratio peak (weekly data) to the next high was 49%. The two year increase was 59% and the three year increase was 136%.
Yes, highs in the ratio showed good times to purchase silver, based on price increases over the next one to three years.
But that is only part of the story: Divide those nine ratio peaks into bull and bear markets as described above. The average increases are substantially different for bull and bear markets.
Average silver price increases from the ratio peak to the highest prices in the next one—three bear market years were small. One year up 35%, two years up 35%, and three years up 16%. Prices fall in bear markets, so these numbers are not surprising.
But in the two major bull markets for silver (starting 2001 and 2008) since 2001, the average gains were:
One year: 85%
Two years: 120%
Three years: 317%
Prices rise in bull markets. Silver price bottoms often occur at highs in the gold to silver ratio. The rallies can be spectacular.
Rise from 1971 to 1980: $1.39 to over $50.00
Rise from 2001 to 2011: $4.01 to over $48.00
THIS BEGS THE QUESTION: Is silver in a bull market or a bear market as of late 2018?
I believe silver has begun another bull market. Why? What do we know for certain?
- The dollar will devalue. Consumer prices will rise. That new truck in 1965 cost perhaps $2,500, but now costs $40,000 to $60,000. Silver prices will rise as they have since 1991.
- The Federal Reserve wants inflation, not deflation, in asset prices—particularly bonds and stocks. Expect more dollar devaluation as they may sacrifice the dollar and stock market prices to maintain bond markets.
- The Federal government will spend more every year, always run deficits, and will increase debt… until they can’t. Official national debt exceeds $21.8 trillion and can never be repaid with dollars of current value. Either default or massive inflation will occur in our future. Both will boost silver prices.
- The paper COMEX market sets silver prices. The financial elite manage and often suppress prices. Occasionally silver prices run higher and panic the short sellers and powers-that-be. Another massive rally will occur, perhaps soon.
- Since 1991 silver prices have moved upward as the dollar has devalued. Industrial demand and supply of silver are increasing. Investment demand (You should buy silver!) has been weak for several years. Tech stocks were better investments since 2011. But tech stocks have broken their uptrends and have fallen over 20% from their recent highs. Expect lower tech stock prices and higher silver prices in 2018 – 2020.
- Another credit crunch, like 2008, is coming. A stock correction/crash is occurring. Stocks have further to fall in 2019.
- Silver is no one’s liability. This will become more important when markets crash. Silver will remain valuable long after people have forgotten crazy tech stock prices, negative interest rate bonds, current political nonsense, stock buybacks, and guaranteed to devalue fiat currencies.
- Silver is inexpensive compared to gold, the DOW, S&P 500, M2 and total debt. Other articles have documented these ratios.
- Bull market rallies in silver prices are substantial when gold to silver ratios are high, such as now.
- Our current financial system uses debt-based fiat dollars. This is unlikely to change for years, perhaps decades. Silver will retain its value and appreciate to many times its current price.
Why: Continual dollar devaluation, unpayable debt, crashing currencies, correcting stock markets, inevitable pension fund collapses and bailouts, more wars, and the list continues. Read: “The Case for Gold and Silver”.
Buy silver! Use those recycled fiat dollars and put them into something lasting and valuable.
Miles Franklin sells silver. Call them at 1-800-822-8080 and tell then you agree with the Deviant Investor about silver. Your price will not change, but I might receive a benefit if you give my name as your reference.
 Gary Christenson is the owner and writer for the popular and contrarian investment site Deviant Investor and the author of the book, “Gold Value and Gold Prices 1971 – 2021.” He is a retired accountant and business manager with 30 years of experience studying markets, investing, and trading. He writes about investing, gold, silver, the economy and central banking.


