Gold Price & Silver Price Updates


As written two weeks ago, Gold very likely is within its final capitulation. Crashing through the last support zone between US$1,130 and US$1,140 opened up the door towards my often announced target US$1,035-US$980. The price action of the last two weeks is basically a weak consolidation below $1,100 which suggests that there will be more downside action soon. Neither the mining shares nor the other metals showing any positive divergences yet. Only the fact that Silver is holding up better than Gold is an indication that we are indeed in the final stage of this bear market. Remember silver topped 4 months before Gold in 2011 and might therefore have bottomed already.
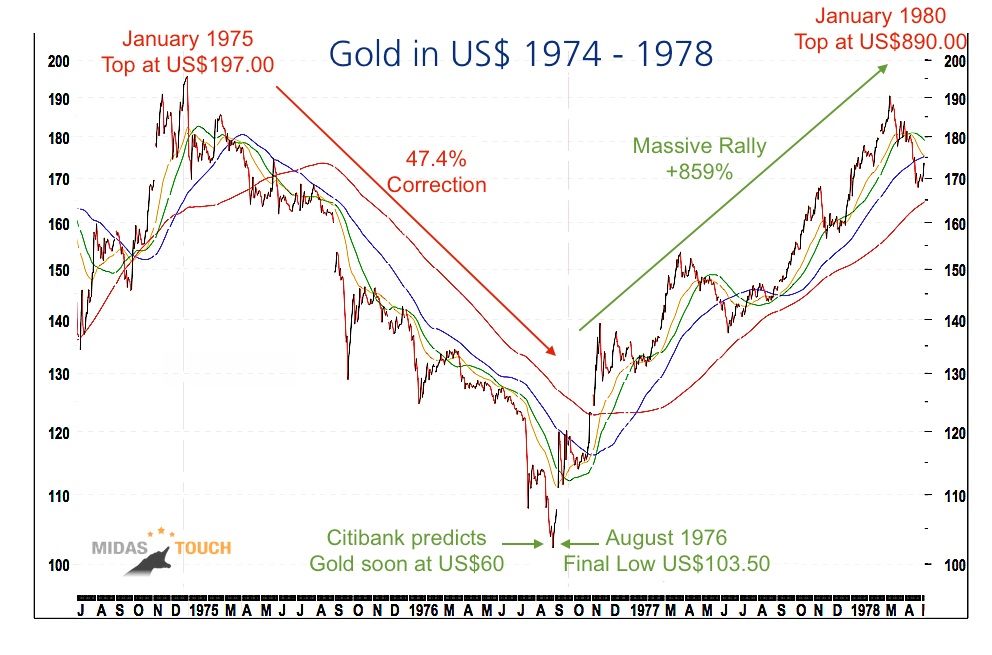
History does´t repeat itself but it does rhyme. Therefore it is always very helpful to study past price action. This chart from 1974-1976 is a classic and I have pointed out numerous times during the last three years that you could multiplicate the 70ies bull market times 10 and will land more or less in today´s price range. This chart also makes clear that the flash crash we have witnessed two weeks ago kind of happened in a similar way in 1976 just before the end of Gold´s bearmarket. Very similar also is the ongoing consolidation since the flash-crash. According to this chart the final selloff down towards $1,000 should happen within the next 1-3 weeks.
The Midas Touch Gold Model
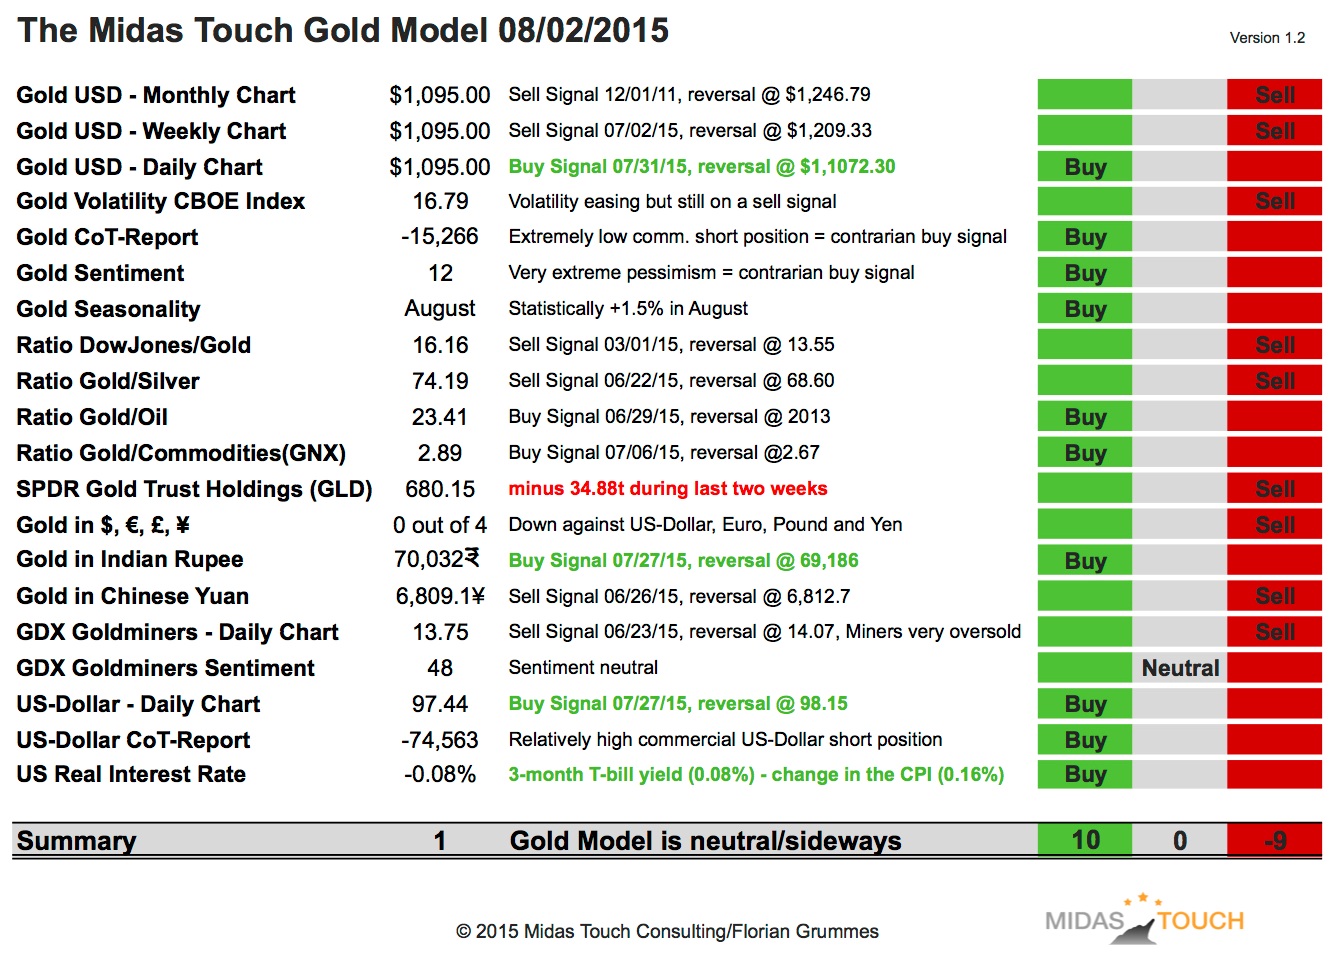
This weekend my mechanical model went back to Neutral/Sideways Mode.
There are new buy signals for the Gold USD-Daily Chart, Gold in Indian Rupee and the US-Dollar Daily Chart. The buy signals for Gold CoT-Report, Gold Sentiment and Seasonality are intensifying.
On the other hand, the SPDR Gold Trust lost 34.88 tonnes during the last two weeks and continues to deliver a strong sell signal. Investment demand does not exist at the moment. ETF investors are capitulating and dumping their shares into the market. Overall the model is in Neutral/Sideways Mode and Gold might continue to consolidate around/below US$1,100 for some more trading days.
Gold Daily Chart
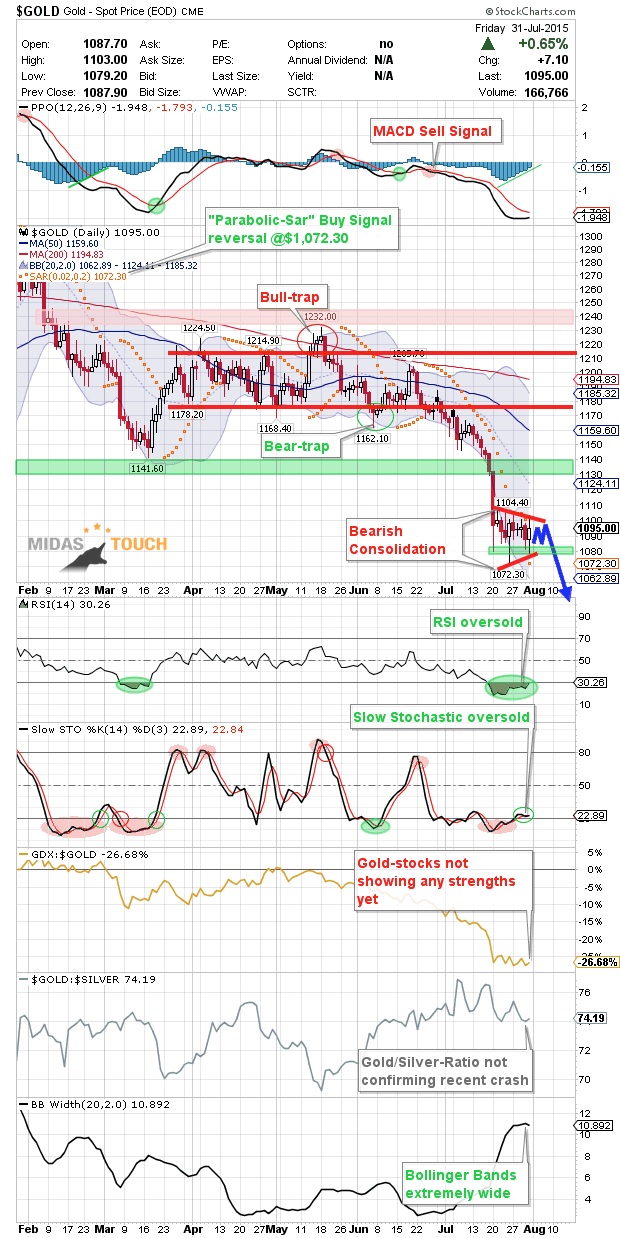
After crashing through US$1,130 Gold has spend the last two weeks consolidating between US$1,080 and US$1,106. It looks like this might continue for some more days or even weeks. Overall this price action is bearish and should ultimately lead to lower prices. Once US$1,080 is clearly broken everything could happen very fast. While the MACD sell signal from end of June is still active, the RSI as well as the Slow Stochastic are moving up from extreme oversold levels. Therefore we probably should have some more time before the crash continues. Should this long expected sell-off down towards $1,035 really happen I am looking for some positive divergences in these indicators which would confirm that this indeed is the final wave of the 4 year bear market. Is there a chance for an immediate recovery and a rally towards US$1,125-US$1,140? Yes, but I´d rate it a very low probability especially as long as Gold is trading below $1,106 and below US$1,115. Once the final down wave hits the market it will present an epochal opportunity.
Swing-traders should use the time to plan a long trade. The entry should be below US$1,035 (maybe scaling in between US$1,030 and US$985) with a wide stopp below US$970. I think mental rehearsal and stalking are the keys in the coming days and weeks. We are very close to the final low in the Gold-market. The market will test the old resistance between US$980 and US$1,035 which now acts as super strong support.
During the last two weeks investors had the chance to accumulate physical Gold below US$1,100. I am lowering the next limits to US$1,050 and US$1,000. Once we are below US$1,000 buy more aggressively as this is a great price for the shiny metal. The risk/reward here is already outstanding but you need to bring at least 3-5 year of patience with you.
Long-term personal believes
The return of the precious metals secular bull market is moving step by step closer and should lead to the final parabolic phase (could start in summer 2015 or 2016 and last for 2-5 years or even longer). Before this can start Gold will need a final selloff down to $1,050-$980. My long-term price target for the DowJones/Gold-Ratio remains around 1:1. and 10:1 for the Gold/Silver-Ratio. A possible long-term price target for Gold remains around US$5,000 to US$8,900 per ounce within the next 5-8 years.
Fundamentally, as soon as the current bear market is over, Gold should start the final 3rd phase of this long-term secular bull market. 1st stage saw the miners closing their hedge books, the 2nd stage continuously presented us news about institutions and central banks buying or repatriating gold. The coming 3rd and finally parabolic stage will end in the distribution to small inexperienced new traders & investors who will be subject to blind greed and frenzied panic.
********
If you like to get regular updates on this model and gold you can subscribe to my free newsletter here: http://bit.ly/1EUdt2K
 Florian Grummes (born 1975 in Munich) has been studying and trading the Gold market since 2003. In 2008 he started publishing a bi-weekly extensive gold analysis containing technical chart analysis as well as fundamental and sentiment analysis. Parallel to his trading business he is also a very creative & successful composer, songwriter and music producer. You can reach Florian at: [email protected].


