Gold Price Sticks Our $1526 Fix


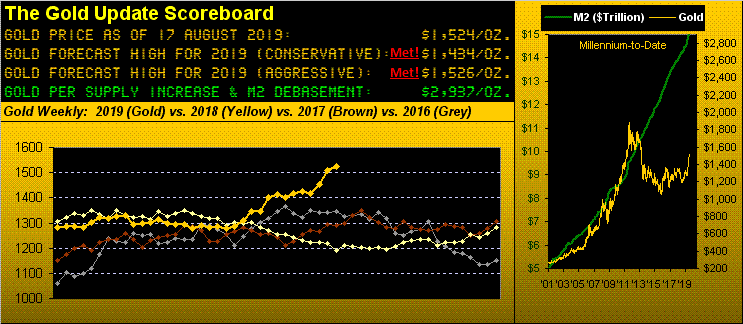
There's something about Tuesdays.
Twelve Tuesdays ago, Gold was trading in the 1200s: 'twas late May.
Eight Tuesdays ago whilst quietly ensconced pre-dawn inside L'Aéroport Nice Côte d'Azur's Terminal II, we penned on the website's daily commentary page "...Gold has traded up through our 'conservative' forecast high for this year (of 1434) to 1436...we shall reassess our 'aggressive' forecast for 1526..."
This past Tuesday we thereon wrote"...Gold yesterday reached our 'aggressive' forecast high of 1526 and thus far in this session has traded up to 1546..."
Regardless whether Gold is departing the doldrums or achieving milestones, this year 'tis been so penned come Tuesdays. And apropos of word finally making the media rounds about Gold's robust rise, we're musically put in mind of the '85 hit tune "Voices Carry" by Aimee Mann's band 'Til Tuesday.
A cute way to couch it, perhaps, Gold having reached both of our categorized forecast highs for this year. But to really face the music, "Where Do We Go from Here?"--[Chicago, '70]. After all, we've still better than four months to run in 2019.
We shan't categorize a third forecast for this year, such as a "hyper high": 'twould be cheating to not have initially so done back in January. To be sure, fundamentals remain solid for Gold, the 3Ds of Debasement, Debt and Derivatives being the natural, primary price drivers. And seeing the 1600s for Gold by year-end wouldn't surprise any of us a wit: with price having settled the week yesterday (Friday) at 1524, that's already a year-to-date gain of nearly 19%. What's another several percent points to 1600, eh? Since 1975 there've been 11 years that have well exceeded Gold's percentage growth rate this year-to-date.
Still technically, we've a negative and a positive condition to point out, both of which you regular readers already well know.
■ The negative technical is that by which we concluded to postulate 1526 for this year as our "aggressive" high. Here's why, courtesy of the "Support Becomes Resistance Dept." with Gold by the month across the last ten years. The red line is 1526:

■ The positive technical remains the vast dearth of trading activity from the 1400s up into the 1600s, our popular Gold-by-the-100s graphic as next updated. It does give the 1600s that "rest and reconnoiter" look prior to the panic push. Further, think of the personal embarrassment (let alone other asset erosion) of not owing Gold the day it crosses above 2000; that's one cocktail party at which you'd be cowering in the corner:
As noted, since having achieved 1526 this past week, Gold come Tuesday found itself as high as 1546 before careening down 65 points (-3.7%) in just three hours to 1489, exacerbated by Jul's strong retail inflation report and TariffTwists. Upon the dust clearing, Gold posted a net weekly gain of 16 points (+1.0%), the dots of the parabolic Long trend nonetheless accelerating their upside pace as we next see in the weekly bars to this date from a year ago:
As for the economy, our StateSide Economic Barometer continues its descent, its last notable ascent coming better than a year ago as the TrumpTaxTrim worked its way through the system and year-over-year corporate earnings surged. But this time 'round with Q2 Earnings Season having run its course as of yesterday, for some 2,070 companies reporting, only 53% (and 64% of reporting S&P 500 companies) bettered their Q2 earnings-per-share of a year ago. Such comparative "dis-improvement" is perhaps warped by 2018's steroidic tax cut injection. As we've recently mentioned, the economy's growth (+2.1% annualized Gross Domestic Product pace per Q2's initial reading) is faster than the +1.9% average of the Obama Era, and just this past week, Jul's Retail Sales tripled expectations. But then, too, came the mitigants of a negative change in Industrial Production and slowing Housing Starts. Moreover came the momentary movement of the 10-year Treasury Note's yield a wee bit below that for two years, such instance of which the GetTrumpMedia milked to the hilt. Still at the end of the day, accounting for each Baro metric's change in performance, revision to prior performance change, and performance vs. expectations, the trend remains down:
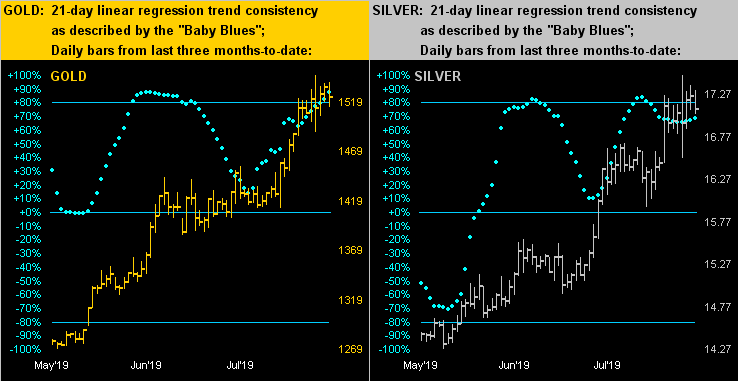
The trends that remains up are those for the precious metals, starkly evident in this two-panel graphic of Gold's daily bars across the last three months-to-date on the left and those for Silver on the right. For both markets, the baby blue dots of linear regression trend consistency clearly are upside energized. But do bear in mind the Gold resistance as earlier shown 'round our achieved forecast high of 1526:
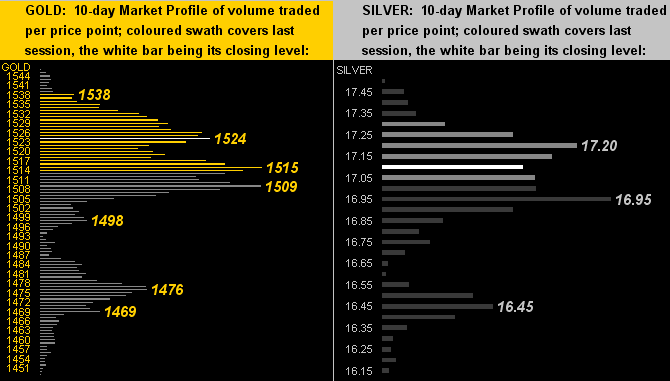
Here next are the 10-day Market Profiles for Gold (left) and Silver (right). As indicated, the volume of contracts traded for Gold has been concentrated in the 1509-1524 range, whilst that for Sister Silver has ranged from 16.95 to 17.20:
So we'll close it out here with Gold's rising track up through its stack, price currently above the mid-point, (so 'twould seem for the first time in forever):
The Gold Stack
Gold's Value per Dollar Debasement, (from our opening "Scoreboard"): 2937
Gold’s All-Time High: 1923 (06 September 2011)
The Gateway to 2000: 1900+
Gold’s All-Time Closing High: 1900 (22 August 2011)
The Final Frontier: 1800-1900
The Northern Front: 1750-1800
On Maneuvers: 1579-1750
2019's High: 1546 (13 August)
10-Session directional range: up to 1546 (from 1449) = +97 points or +6.7%
Trading Resistance: 1538
Gold Currently: 1524, (expected daily trading range ["EDTR"]: 27 points)
Trading Support: here at 1524 / 1515 / 1509 / 1498 / 1476 / 1469
10-Session “volume-weighted” average price magnet: 1509
The Floor: 1466-1579
Le Sous-sol: Sub-1466
The Weekly Parabolic Price to flip Short: 1423
Base Camp: 1377
The 1360s Double-Top: (1362 in Sep '17 and 1369 in Apr '18)
Neverland: The Whiny 1290s
The 300-Day Moving Average: 1287 and rising
The Box: 1280-1240
2019's Low: 1267 (02 May)
Center stage next week is nuthin' but Fed: the Federal Open Market Committee's meeting minutes from their 30-31 July mental machinations shall be released on Wednesday (21 August), the follies culminating with Chair Powell himself come Friday morning (23 August) from altitudinous Jackson Hole in income taxless Wyoming. Now there's an opportunity savings to buy Gold!
www.deMeadville.com
www.TheGoldUpdate.com
********

Mark Mead Baillie has had an extensive business career beginning in banking and financial services for two years with Banque Nationale de Paris to corporate research for three years at Barclays Bank and then for six years as an analyst and corporate lender with Société Générale.
For the last 22 years he has expanded his financial expertise by creating his own financial services company, de Meadville International, which comprehensively follows his BEGOS complex of markets (Bond/Euro/Gold/Oil/S&P) and the trading of the futures therein. He is recognized within the financial community of demonstrating creative technical skills that surpass industry standards toward making highly informed market assessments and his work is featured in Merrill Lynch Wealth Management client presentations. He has adapted such skills into becoming the popular author each week of the prolific “The Gold Update” and is known in the financial website community as “mmb” and “deMeadville”.
Mr. Baillie holds a BS in Business from the University of Southern California and an MBA in Finance from Golden Gate University.


