The Gold Price Target


A first time for everything. This week was the first time I ever went to basically cash before the jobs report was released. It’s still too early to know yet if this was a right or wrong decision depending on what the stock markets do next week. I thought I’d give it a shot as these job reports always seem to catch you leaning the wrong way especially in a sideways trading range. Today was no exception. Many times a big rally on a Friday will lead to some follow through on Monday and then we get turn around Tuesday. At any rate we have a lot of cash on the sidelines that can be put to work when the time is right.
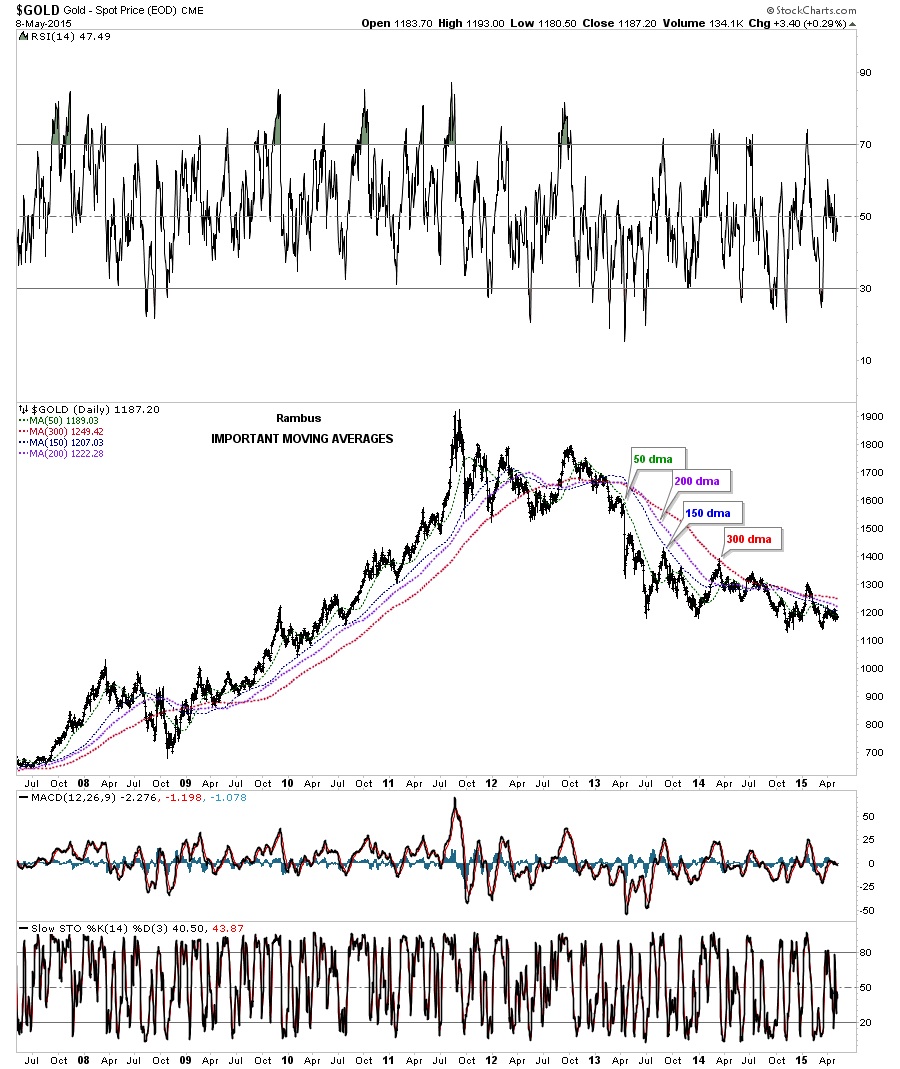
The first chart I would like to show you tonight is a long term daily chart for gold that shows the four most important moving averages. As of the close today gold is trading below all the moving averages. As you can see they did an excellent job of holding support during the bull market years from 2008 to the top in 2011. Since the bear market really got going in April of 20013 the 300 dma has done a good job of holding resistance except for couple of little overshoots. The 300 dma will be one of the things I’ll be watching very closely when gold finally turns around.
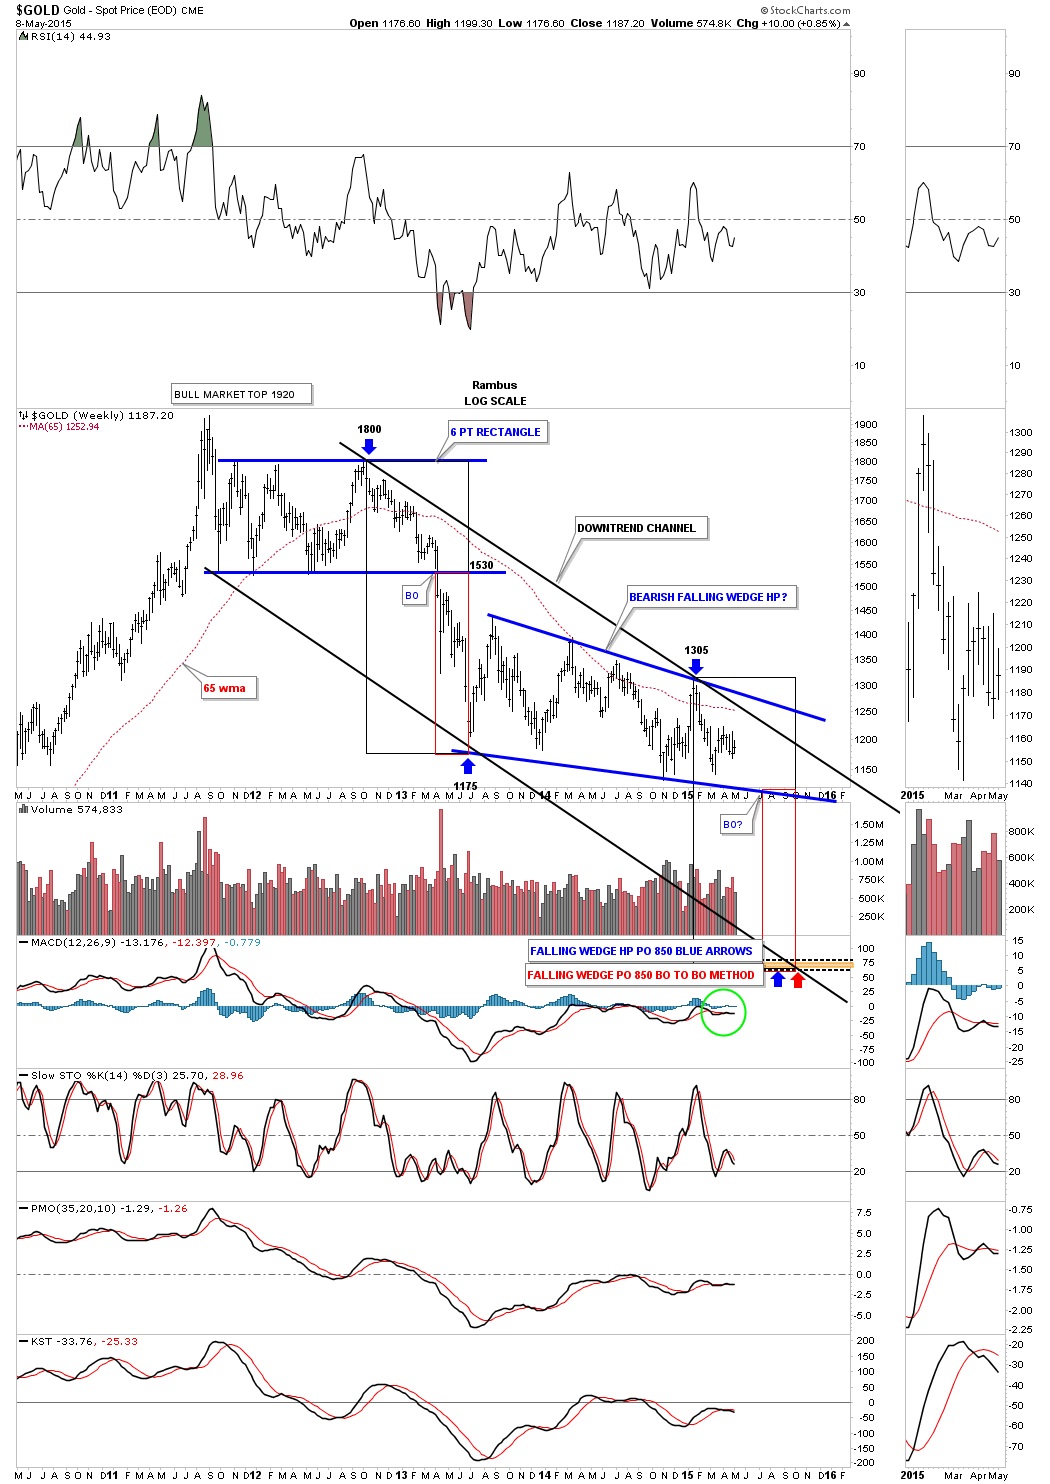
It’s been awhile since I last showed you this weekly chart for gold that encompasses its bear market with the 65 week moving average. So far gold has produced a parallel downtrend channel with the six point blue rectangle at the top of the chart and our current falling wedge that just keeps on building out but within the confines of the top and bottom rails of the 3 1/2 year bear market. Our current falling wedge will be two years in the making come late June of this year which is the longest consolidation pattern in the bull and bear markets that started in 2000 or so.
Note the speed and magnitude of the impulse move down once the 6 point blue rectangle finished building out. There was one last little counter trend move the bulls put in just before the bottom fell out in April of 2013. This chart also shows the two different measuring techniques I use to measure an impulse move once a consolidation pattern is completed. The blue arrows shows the impulse method which measures each leg down that are the same in price and time, black rectangles. The other method shows the breakout to breakout method where I measure from the breakout point of the blue rectangle down to the first reversal point in the falling wedge. I take that measurement and add it to the breakout point of the falling wedge, which hasn’t occurred yet, to get a price objective. Many times these two different measurements will be fairly close price wise. In this case both measuring techniques gives us a price objective down to 850 sometime in October of this year.
If you look real close you can see two red rectangles that measures each impulse move down in time and price. Gold can break the bottom rail of the falling wedge, in the middle of July, and still have time to reach its price objective of 850 in October of this year. So if gold is on track to reach its time and price objective, in October of this year, we will need to see gold trading toward the bottom rail of the falling wedge, around the 1120 area, come the middle of July at the latest.
One last note on this weekly chart. In order for me to get really bullish the first thing I will need to see is gold trading above its 65 week moving average. The second thing I need to see is gold trading above the top rail of the black downtrend channel and the third thing is to see gold trading above the top rail of the blue falling wedge. If gold can do that then so be it and I’ll become a bull again. All the best…Rambus
 Meet Rambus, a seasoned trader and technical analyst renowned for his unbiased and insightful chart work. Through his website, Rambus Chartology, and Substack newsletter, Rambus shares his expertise with a global community of subscribers, providing daily updates, commentaries, and hands-on training in the art and science of chartology. With his calm, humble, and down-to-earth approach, Rambus demystifies complex market trends, helping his followers navigate the challenges of today's volatile markets. Join the Rambus Chartology community today and discover a unique blend of technical analysis, trading expertise, and time-tested protocols. Subscribe now at www.rambus1.com or https://rambuschartology.substack.com/


