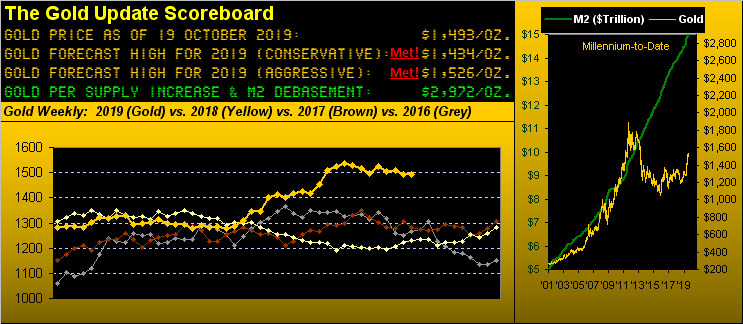
Gold Price - Trading Range Tapering At 1500; Price Spring Coiling for 1600?


A week ago at this time, Gold's "expected daily trading range" (which for you WestPalmBeachers down there is how many estimated points we 'spect there'll be between Gold's high and low for the next trading day) was 24 points, the "expected weekly trading range" then being 48 points. Cue reality:
Gold settled yesterday (Friday) at 1493.4 ... we're noting the ".4" such as to differentiate price from where 'twas a week ago at 1493.5 ... and thus Gold posted a net loss for the week of one li'l ole trading pip, i.e. -10¢. Moreover, (or perhaps better stated, "lessover"), Gold's trading range for the entire week was 22 points, not even that "expected" for a single day let alone for five of 'em combined. From high (1503.0) to low (1480.6), the -1.5% swing was seventh narrowest this year-to-date, indeed the narrowest week since that ending 24 May, in turn sporting the narrowest net change (that one pip) for a full week since that ending 30 August 2013. Where'd all the excitement go? Who turned out the lights?
'Course fundamentally -- beyond Turkish/Syrian battling (where at the moment they're at "halftime"), StateSide Presidential impeaching, Parliamentary Brexit voting (to again delay), global economic data weakening, and renewed Federal Reserve Bank U.S Treasury Bills buying -- there's really nuthin' goin' on out there. (Please put Gold back in the relics attic next to that pile of Uncle Egbert's indestructible polyester pants).
'Course technically, what just happened with Gold?
"Back-to-back inside weeks, mmb?"
Spot-on Squire. Gold just again sported both a "lower high" and a "higher low", which for two weeks in-a-row is quite rare, this being just the fifth such consecutive occurrence since the turn-of-the-century. And save for such first docile occurrence back in 2001, each subsequent set of back-to-back inside weeks has acted as a coiled spring in then shooting Gold to materially higher levels.
So with ten full trading weeks still to run in 2019, let's compare Gold's pricing ten weeks beyond the coiled springs of the those prior rare consecutive inside weeks: in 2002, price went from 279 up to 308 (+10%); in 2008 price went from 734 up to 892 (+21%); and in 2013 price went from 1093 up to 1191 (+9%). So should history repeat itself and Gold spring forth from here by, say, 10% before year's end, 'twould see 1642! (Be thee not too quick to place Gold in the relics attic, just in case...)
As to Gold's present case, let's update our graphic of its closing prices by the "100-Handle" groupings since settling at the highest ever --1900-- back on 22 August 2011. And therein, "The Gap" remains obvious with 1600 waiting in the wings per the albeit arguable trader's theorem that "all gaps get filled". Brings to mind for you blues rockers out there the super-charged John Mayall piece from '69: "Room to Move":

However more to the present, Gold remains in its corrective parabolic Short trend, now five weeks in length, price therein having traded as low as 1465 (01 October), but not so deep as to test the 1454-1434 support shelf. Yet as narrow as was this past week's trading range, pressing deeply down on a coiled spring only becomes exponentially more difficult, (barring the spring itself suffering catastrophic structural failure):
"Failure" indeed seems more apropos of the recent track for our Economic Barometer, such stance ought being Gold favourable. Further, look below at the graphical expanse between the level of the S&P 500 (red line) which historically has always moved to the level of the Baro (blue line). And 'twasn't the prettiest week for incoming metrics: October's Philly Fed Index halved itself from 12.0 to 5.6; and September posted negative slips for Industrial Production of -0.4%, Retail Sales of -0.3%, and Leading Indicators of -0.1%. Yes, various near-term technical trends for Gold also show as negative, but 'tis its buoyancy therein that counts, luv:
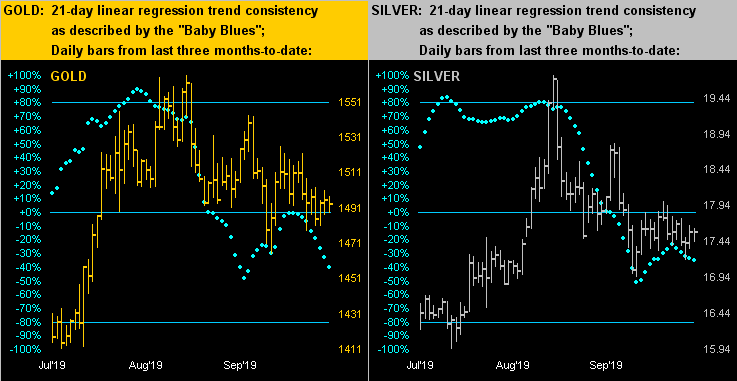
Indeed to trends we go, these next two of course from the website's Market Trends page. Here we've the daily bars across the last three months-to-date for Gold on the left and Silver on the right. To be sure, in both panels the baby blue dots of linear regression trend consistency are pointing to further price fallout. But given all of the aforementioned fundamental and economic Gold positives presently afoot, the rightmost price bars of both the yellow and white metals at worst look not so much negative as do they namby-pamby, (or even coily-springy):
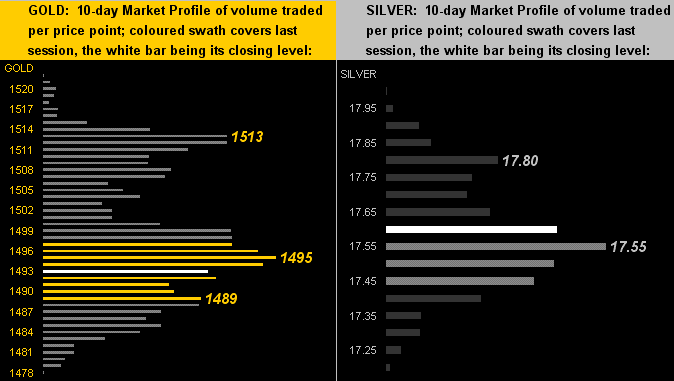
Thus it follows next within the 10-day Market Profiles for Gold (below left) and Silver (below right) that we find their respective present prices centered, or nearly so:
And certainly centered in the broad case of The Stack is "Gold Currently" at 1493:
The Gold Stack
Gold's Value per Dollar Debasement, (from our opening "Scoreboard"): 2972
Gold’s All-Time High: 1923 (06 September 2011)
The Gateway to 2000: 1900+
Gold’s All-Time Closing High: 1900 (22 August 2011)
The Final Frontier: 1800-1900
The Northern Front: 1750-1800
On Maneuvers: 1579-1750
2019's High: 1566 (04 September)
The Weekly Parabolic Price to flip Long: 1553
10-Session “volume-weighted” average price magnet: 1498
Trading Resistance: 1495 / 1513
Gold Currently: 1493, (expected daily trading range ["EDTR"]: 21 points)
Trading Support: 1489
10-Session directional range: down to 1478 (from 1522) = -44 points or -2.9%
The Floor: 1466-1579
Le Sous-sol: Sub-1466
Base Camp: 1377
The 1360s Double-Top: (1362 in Sep '17 and 1369 in Apr '18)
The 300-Day Moving Average: 1325 and rising
Neverland: The Whiny 1290s
The Box: 1280-1240
2019's Low: 1267 (02 May)
'Tis clear that Gold has put in a solid year. Upon achieving our "aggressive" forecast high so far of 1526 on 12 August, price was +18.8% year-to-date. Then following the typical technical overshoot, price rotated about that 1526 level so much so that we dubbed it the "centerpiece" price. But should the coiled spring lead to 1600 being tapped by year's end, 'twould be a year-to-date run of +24.5%. Possible? In 2009 Gold's net yearly change was indeed +24.5%. As well, in 2002 'twas +24.8%, in 2010 +29.5%, and in 2007 +31.2%. Possible! How lovely 'twould be to be wrong about our 1526 forecast high for this year. Fly Gold!
www.deMeadville.com
www.TheGoldUpdate.com
*********

Mark Mead Baillie has had an extensive business career beginning in banking and financial services for two years with Banque Nationale de Paris to corporate research for three years at Barclays Bank and then for six years as an analyst and corporate lender with Société Générale.
For the last 22 years he has expanded his financial expertise by creating his own financial services company, de Meadville International, which comprehensively follows his BEGOS complex of markets (Bond/Euro/Gold/Oil/S&P) and the trading of the futures therein. He is recognized within the financial community of demonstrating creative technical skills that surpass industry standards toward making highly informed market assessments and his work is featured in Merrill Lynch Wealth Management client presentations. He has adapted such skills into becoming the popular author each week of the prolific “The Gold Update” and is known in the financial website community as “mmb” and “deMeadville”.
Mr. Baillie holds a BS in Business from the University of Southern California and an MBA in Finance from Golden Gate University.


