Gold Seeks Support As Its Trend Flips Short


We penned in our prior missive that: "...Gold in the technical vacuum is quite stretched to the upside..."
Indeed no sooner was that written then did Gold's weekly parabolic Long trend finally come to its end. Below, per the rightmost red dot, such trend is now Short:

"But do you really think Gold actually can go down with all that's going on, mmb?"
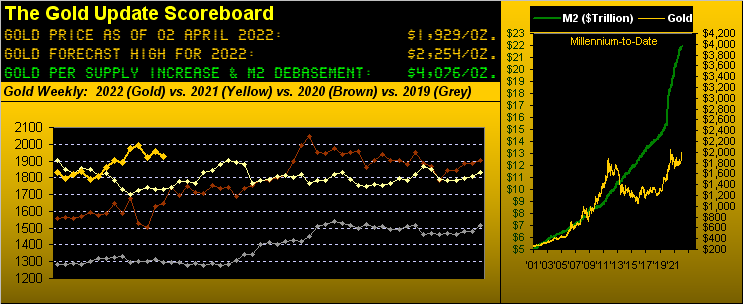
Squire: the fact that -- given debasement and war and inflation -- Gold hasn't yet gone to the moon, is stunning to many an analyst. Merely as you can see per the debasement measure alone in our opening Scoreboard, price today "ought be" 4076. Yet, it settled out the week yesterday (Friday) at 1929. And en route to so doing, the week's low (1888) was more than ample to flip the Long trend -- after 21 weeks in duration -- to Short upon passing down through 1910.
So how much downside price adversity might we expect for Gold during this parabolic Short trend? Since the beginning of 2021, there've been two such Short trends. The first ran for 11 weeks with maximum downside adversity of -110 points (-6.2% from 1783 to 1673); the second lasted 18 weeks with identical downside adversity of -110 points (-6.1% from 1788 to 1678).
So mix that in from Gold's present price of 1929, and -110 points of adversity calls for 1819; or instead by -6.2% we'd similarly arrive at 1809. Not that history perfectly repeats, but both of those constructs would put price smack into the center of the 1854-1779 underlying support zone we've mentioned in recent weeks. Moreover should that actually recur, putting the Gold Whiners in -- well -- full whine, you can cite that such pullback is perfect normal. However of greater import, we're still locked into Gold getting up to 2254 this year. Gold thus has had some up; it may now weather some down; and then again resume up further into an All-Time High (2090), and beyond... Just like a real market. ("Hey Mabel! Ain't that sumpthin'?")
Here, too is "sumpthin'": the year-over-year percentage tracks of Gold along with some of the most respected precious metals equities. Look below at their most recent, rightmost performances: are the equities leading the metal? Ahhh, hope springs eternal for those bars 'n coins in your bunker. But again, do these metals equities historically lead Gold itself? Research says: "Absolutely sometimes!" So no help there, albeit our bent remains that as goes Gold, so go the equities. Nonetheless, from a year ago-to-date we've kick-ass Newmont (NEM) +32%, Franco-Nevada (FNV) +25%, the VanEck Vectors Gold Miners exchange-traded fund (GDX) +17%, Gold itself +12%, Agnico Eagle Mines (AEM) +5%, the Global X Silver Miners exchange-traded fund (SIL) -9%, and Pan American Silver (PAAS) -10%. Yes, "The Silvers" obviously are lagging. The present Gold/Silver ratio is 77.9x vis-à-vis the average from 2001-to-date of 66.6x. So priced by the average, Silver today would be at 28.95 rather than the present 24.76. Either way, here's the graphic:
Speaking of equities in general, here's yet another "sumpthin'": you sharp-eyed website followers likely noted the "live" price/earnings ratio of the S&P 500 re-achieved 40x during this past Wednesday, even as interest rates are on the rise. For how much longer can S&P investees keep kidding themselves? Recall this from Jerome B. Cohen's collegiate textbook "Personal Finance: Principles and Case Problems, (pg 771):
■ "In a bear market many stocks will sell at 5 to 7 times earnings, while in bull markets the average level would be about 15 to 18 times earnings."
'Course, that was published back when interest rates were positive. Today, folks instead chase equity prices. Regardless, the S&P's lifetime average P/E at this writing is 23x ... and yet we just revisited 40x? Think about it. And sadly, it could be more than just the first domino being tipped:
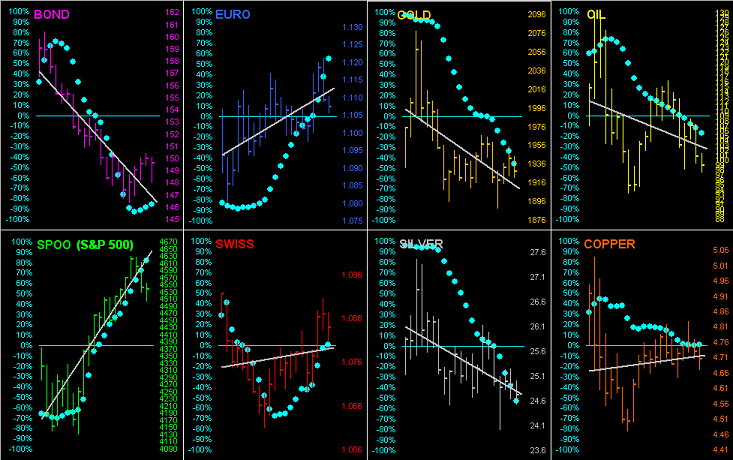
Thus with that grasp of reality under your belt, plus it being month-end and indeed quarter-end (plus a day), let the graphics parade begin, starting with the year-to-date standings of our BEGOS Markets, Gold just shy of a podium position:
And therein, much to conventional wisdom chagrin, we again see that Gold plays no currency favourites. For even as the Dollar Index year-to-date is +3.0%, nonetheless is the yellow metal +5.4%. "Got Gold?" 'Course, Black Gold is leading second-place Silver fivefold, whilst rising yields find the last-place Bond having traded down to its lowest level in nearly three years.
Not surprisingly in the midst of it all, we find the Economic Barometer remaining in decided descent. Oh to be sure, there were some improved inputs this past week: for March, improvements came to the Chicago Purchasing Managers Index, the Unemployment Rate, Hourly Earnings, Consumer Confidence and February's Personal Income, even as the Core reading of the Fed-favoured Personal Consumption Expenditures Index dropped a pip. But these were mitigated and then some by slowing or reductions in March's ADP Employment data, Labor's Nonfarm Payrolls and Average Workweek Hours, plus in the Institute for Supply Management's Manufacturing Index, as well as for February's Personal Spending. Too came a reduction in the final reading for Q4 Gross Domestic Product of a 6.9% annualized pace, from which subtracting the Chain Deflator reading of 7.1%, leaves a Q4 StateSide real GDP decay pace of -0.2%. Here's the "upbeat" (what are they smoking?) stagflative view:
And from the "A Lot Can Happen Between Now And Then Dept." (for those of you pro-actively scoring at home), the Econ Baro going forward has 45 incoming metrics up to the 04 May Policy Statement by the Federal Open Market Committee. As you know, the current FedFunds targeted range is now 0.25%-0.50%. However: the FedFunds Futures contract for this next go 'round has already priced in a targeted range of 0.75%-1.00%, (which for you WestPalmBeachers down there means a Fed rate hike of 0.50% is "expected". Still nursing those variable-rate credit cards?)
Mind as well the 21-day linear regression trends of the BEGOS Markets: as shown, they are negative for Gold, Silver the Bond and Oil. Copper is barely hanging on to being positive, whilst the Currencies are up as is the "it never goes down" S&P 500. The baby blue dots denote the day-to-day consistency of the diagonal grey trendlines, which for the precious metals are reinforcing to the downside:
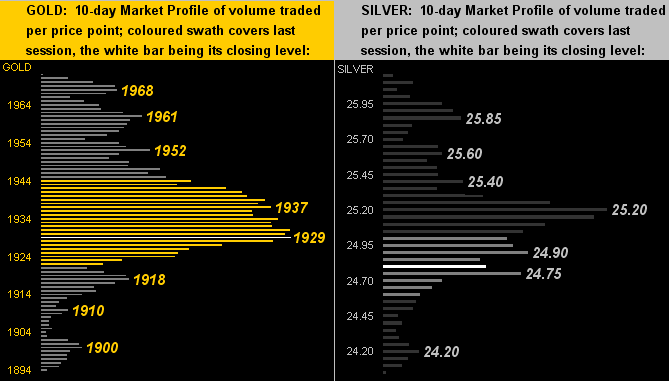
As to the 10-day Market Profiles, here we've Gold below left with its present 1929 level the most heavily-traded price across the past fortnight. Silver below right is comparatively lower with 24.75 as a last bastion of near-term trading support:
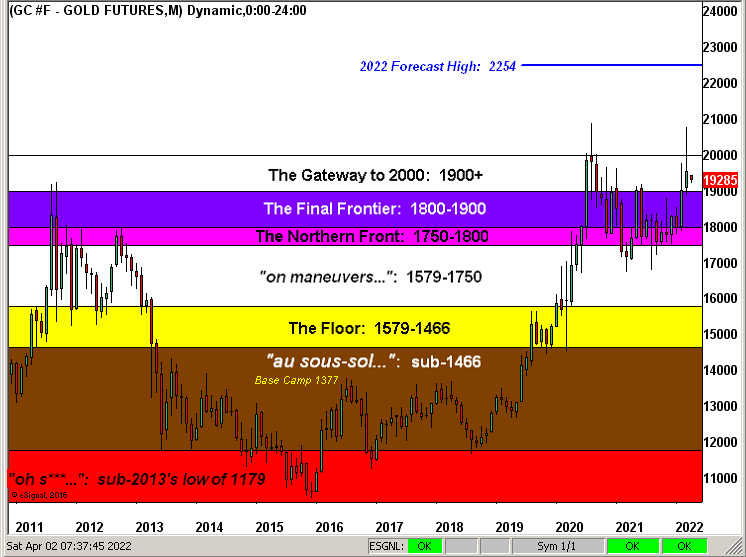
So with three months and a day in the books for Gold's 2022, here is our Structure graphic by its monthly bars from a dozen years ago-to-date. Can Gold reach the 2254 forecast blue line high with nine months in the year's balance? Surely so, even a near-term dip notwithstanding:
To close, we note that the best correlation amongst the five primary BEGOS Markets (Bond/Euro/Gold/Oil/S&P) is between Gold and the S&P. Such correlation remains negative as we see here by their respective percentage tracks from a month ago-to-date (21 trading days):
With that in mind, the selling this past week in the S&P essentially contained "No Fear" as evidenced on the website's S&P MoneyFlow page. In turn, fearless selling generally begets renewed buying, such that if the negative correlation with Gold holds, its near-term price dip we shall behold. And 'tis smart to buy Gold when 'tis being sold: there's a good lad!
Cheers!
...m...
www.deMeadville.com
www.TheGoldUpdate.com
********

Mark Mead Baillie has had an extensive business career beginning in banking and financial services for two years with Banque Nationale de Paris to corporate research for three years at Barclays Bank and then for six years as an analyst and corporate lender with Société Générale.
For the last 22 years he has expanded his financial expertise by creating his own financial services company, de Meadville International, which comprehensively follows his BEGOS complex of markets (Bond/Euro/Gold/Oil/S&P) and the trading of the futures therein. He is recognized within the financial community of demonstrating creative technical skills that surpass industry standards toward making highly informed market assessments and his work is featured in Merrill Lynch Wealth Management client presentations. He has adapted such skills into becoming the popular author each week of the prolific “The Gold Update” and is known in the financial website community as “mmb” and “deMeadville”.
Mr. Baillie holds a BS in Business from the University of Southern California and an MBA in Finance from Golden Gate University.


