GOLD Set To GO – Just A Little EXTRA Push Needed


Gold started the week on the downside but ended ahead by 1.7%. Now, if it only does this every week, we’ll really have a good bull market. However, things do not happen that conveniently. There will be ups and downs as time goes by. Which way the overall direction will take during the rest of the year is a good guess, but I prefer just to follow the daily and weekly action and go with the flow. The basic consideration is that a trend in motion continues in motion until its reversal is confirmed.
SHORT-TERM
The short-term chart perked up a bit this past week and is putting us into position for another short-term rally. We may actually be in one so let’s check the indicators.
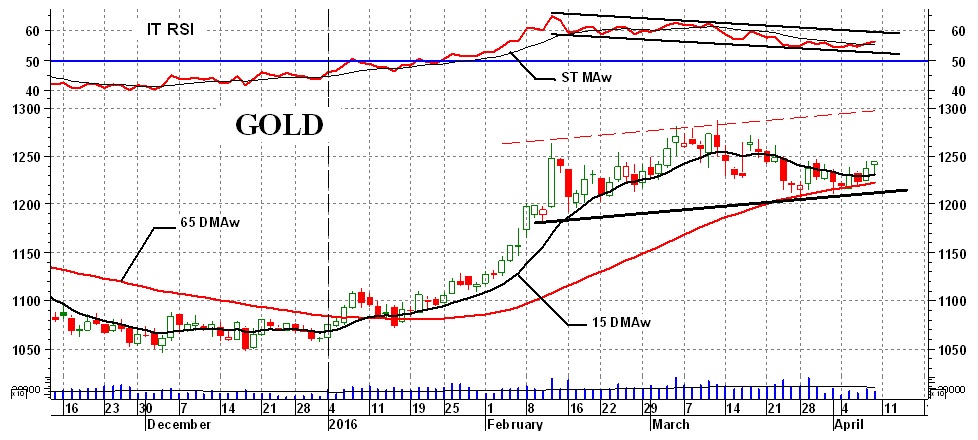
The Friday closing price of gold was above its short-term moving average line. The line itself has perked up and is now pointing upward. The short-term momentum indicator (which attempts to gauge the strength of a price move), although not shown, has also perked up and moved once more into its positive zone and above its short-term positive sloping trigger line.
What can I say, the short-term, at the Friday close, is BULLISH. However, the one cautious indicator is the volume action. See the intermediate term analysis below.
See additional short-term analysis using the point and figure chart later in this commentary.
Looking at the table of 100 gold and silver stocks that I follow, the short-term shows 65% of them are positive and 15% negative.
INTERMEDIATE-TERM
Most of the intermediate-term indicators remain positive. The price action remains above its positive sloping moving average line and the momentum indicator remains in its positive zone. The only caution in these basic indicators is the slope of the momentum trigger line, which is still slightly in a negative direction. However, this does not change the basic intermediate term BULLISH rating.
From the indicator standpoint, the volume action is so far a disappointment. The volume action is represented by the vertical lines at the bottom of the chart. I have included an intermediate-term trigger line to show the volume action versus the average intermediate-term average action. For the past two weeks, the daily volume action has been lower than the average over the past several months. One likes to see volume perk up with a positive price move. With volume action lacking this seems to indicate that the upside move may not have the professional strength behind it that would propel the price much higher. We’ll just have to wait and see if the volume finally perks up or not. Otherwise, this is a real concern.
Looking at the table of 100 gold and silver stocks that I follow, the intermediate-term shows 91% of them are positive and 5% negative.
PATTERNS
I want to spend a little time on the point and figure chart so I’ll just breeze through a look at the patterns this week.
The intermediate-term momentum remains in its downward sloping box pattern but does seem to be bouncing off its bottom and heading towards the upper line. The short-term momentum indicator (not shown) has already breached that upper line and is now into a new positive move.
With recent price action, I have redrawn that upward sloping flag or pennant pattern shown a few weeks ago. More may be said about this flag at a later date.
As we can see the head and shoulder pattern mentioned last week remains in force as only a potential pattern as it has not broken below its neckline for confirmation.
Overall the patterns can still be considered as positive in nature until decisively broken on the downside. Even the momentum trend, although heading in a downward direction is still in its positive zone.
POINT & FIGURE CHART (P&F)
As we draw short-term charts based upon short-term data and criteria they could morph into intermediate-term trends. The same is true using intermediate-term data and criteria morphing into long-term market trends.
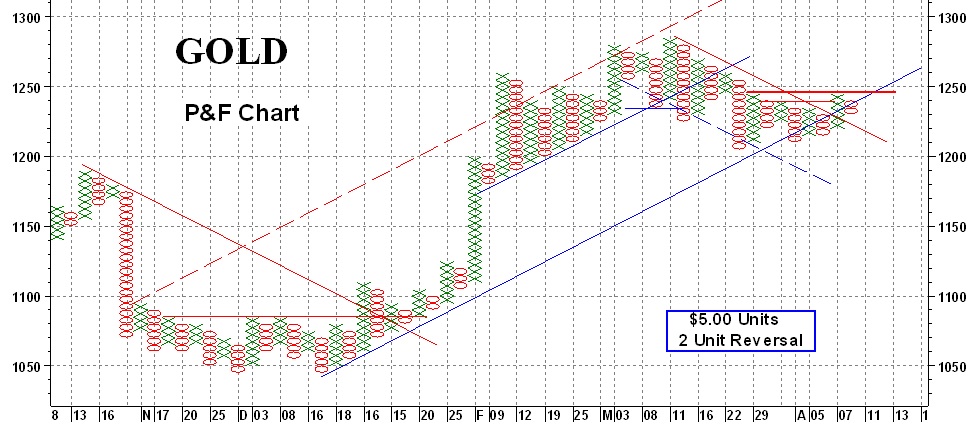
Since the lows late last year, we started the short-term chart with a good uptrend which eventually morphed into an intermediate-term trend. The lower up trending line was originally a short-term uptrend line and is now an intermediate-term line. The short-term uptrend line had moved up into the action in the middle to upper part of the up trending channel (with the dashed line as the upper resistance line).
At the start of the short-term move the buy signal was given at the $1100 mark (a few days prior to the moving average crossover) after breaking above the $1090 resistance level and the downtrend line. The short-term projection at this point was to the $1230 level. Since then the action has been laborious but still bullish. Throughout the bullish move, each reaction to the uptrend ended at a higher level than the previous reaction, which is a very good sign.
The short-term bull ended at the $1235 level after breaking below two previous lows and its new uptrend line. The short-term projection at the break was only to the $1225 level suggesting a not very serious down move. What we have had since has been mostly a sideways action.
This past week we had the move break above its short-term downtrend line and above two previous highs for a short-term P&F bull signal. The projection is only to the $1275 level so at this point, not a strong break. The next break will come when the price moves to the $1250 level for a projection to $1305 and new highs. That would also place the move just at the bottom of the upper flag resistance line for a location when the move might then take a breather.
It should be noted that with the bottom-up trend line now an intermediate-term line, it has not yet provided any bear signal. That would require a break below the uptrend line (which did occur at the $1215 level) AND a move below two previous lows (which has NOT yet occurred).
POLITICAL ACTION
As you understand, gold is quite volatile in its action and moves up and down often due to purely political events which cannot be predicted. For this reason and others, one should always keep constant surveillance on the daily price action for any sudden changes.
********
Readers are invited to view my Facebook page at https://facebook.com/merv.burak where I will be slowly posting commentaries explaining in more detail my various indicators and techniques. I also present from time to time some individual stocks that look as if they may be good speculations. However, nothing I post is meant to be a recommendation to buy or sell. One should check with their broker or investment advisor before acting.
 Merv is a retired Aerospace Engineering consultant. He is also a retired market technician with over 40 years of market experience and research. Merv received his certification as a Chartered Market Technician (CMT) in 1992. Developer of many technical techniques and programs which he has been using in his previous Technically Speaking with Wil-Arm and Technically Precious with Merv commentaries posted throughout the globe. Developer of several gold and silver Indices, Merv continues to update his Merv’s Gold & Silver 100 Index and Merv’s Penny Arcade 50 Index and reviews them during his periodic on-going Technically Precious commentaries.


