Gold & Silver…Current Price Is The Story


Forget all the news, all the fundamentals, all the [mostly errant] price projections. There is a reason why a picture is worth more than 1,000 words, and this is one of those times where it is best to focus on pictures of the market, over various time frames, to get a better handle on what to expect moving forward. Put to rest every so-called PMs pundit or blogger that has persistently been calling for higher prices or saying the low is in.
We keep saying that the best and most reliable indicators come from the market. Time to stop listening about what others have been saying about the market and pay closer attention to what the market is saying about others. Several months ago, we expressed the thought that 2014 would likely be more like 2013 and to not expect a dramatic increase in gold and silver prices. Even that was optimistic as silver just reached recent 4 year lows.
Are the markets manipulated? Absolutely! The United States and United Kingdom are both in the throes of desperation to keep alive the largest ever Ponzi scheme, that of Western central banks run by the unelected bureaucrats of the Bank for International Settlements [BIS], and all of the similarly unelected bureaucrats from the International Monetary Fund [IMF], who rule over all Western governments. Gold, and silver to a much lesser extent, are the proverbial wooden stake to be driven into the heart of the fiat system which rules over your life, realize it or not, like it or not.
Have these unseen faces been successful in suppressing PM prices? Without question. Can it continue? Without question, but the increasingly pertinent question now is, for how much longer? No one has the answer, which has been proven despite the never-ending opinions asserted over the past few years. With each passing month it becomes sooner rather than later, but even sooner is taking longer than most have expected.
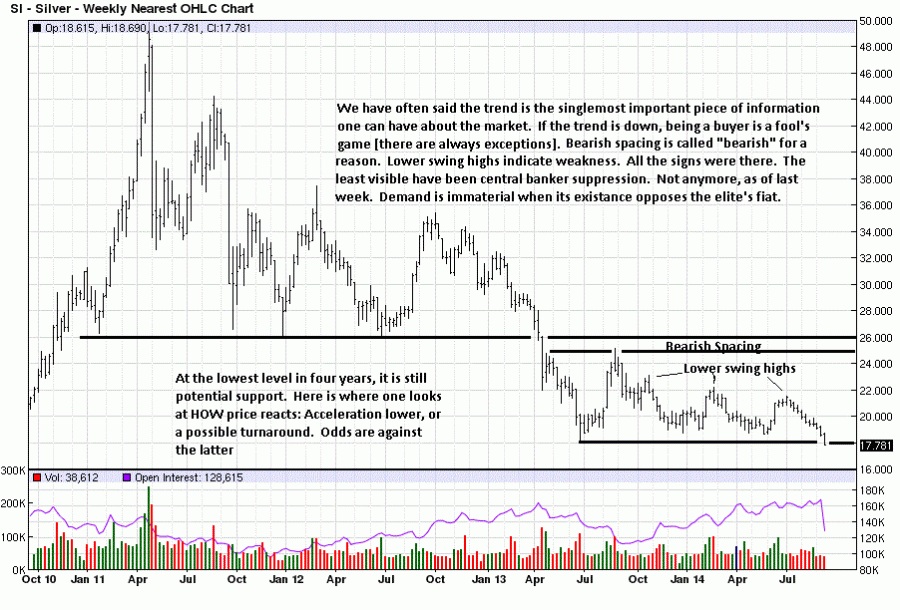
A look at the charts tells us in no uncertain terms that the end is not yet in sight. Here is our read of what the market is saying, and has been saying for some time. We start with silver because it just broke to low levels not seen for the past 4 years. The
importance of acknowledging the trend deserves front and center attention because this simple circumstance is so often overlooked for its power to prevail over price direction. Bearish spacing is also mentioned because of what it connotes: a bearish undertone in the market. With successive lower swing highs, the message of both the trend and bearish spacing have gone unchallenged, and that means there is no way the down trend can end. The KISS principle at work.
Even in a down market, past support still has validity to check, at least temporarily, any downward momentum. It does not mean a turn in trend is imminent, so one should not read sentiment into market reality, rather, just be aware and pay closer attention to how price develops/reacts around this possible support area.
The weekly chart is context, and we look at the daily chart for more clarity, if any is to be found.
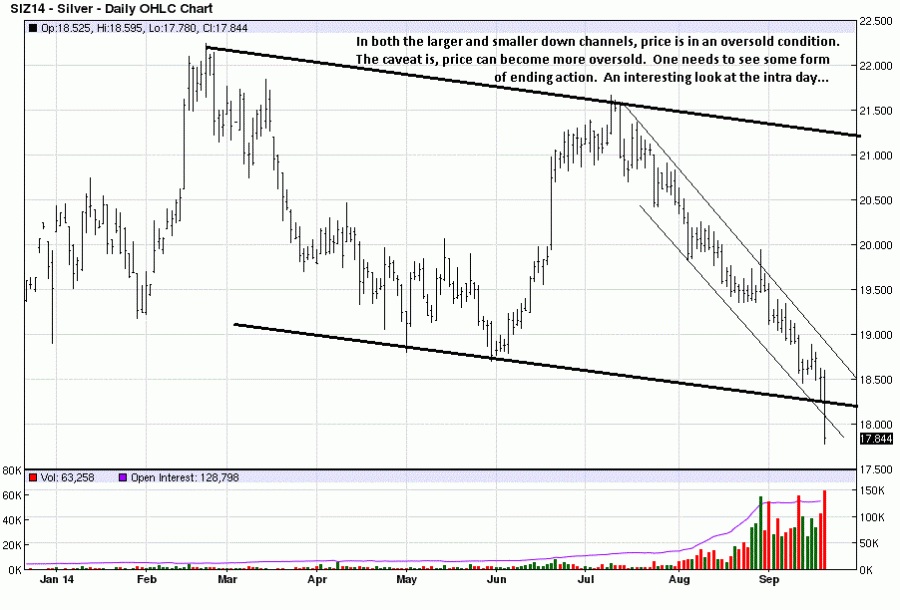
There are no definitive signs of trend change. None. We can see that silver has reached an oversold market condition. That being said, it can never be forgotten that oversold can easily become more oversold, so this current condition is no reason to take a position from the long side in anticipation of an upside reaction.
Ask yourself a simple question. Over the past 4 years, how many longs are showing a profit? Counting on just one hand may provide an adequate answer. Is that the kind of position in which you want to find yourself? This is why the trend is your friend.
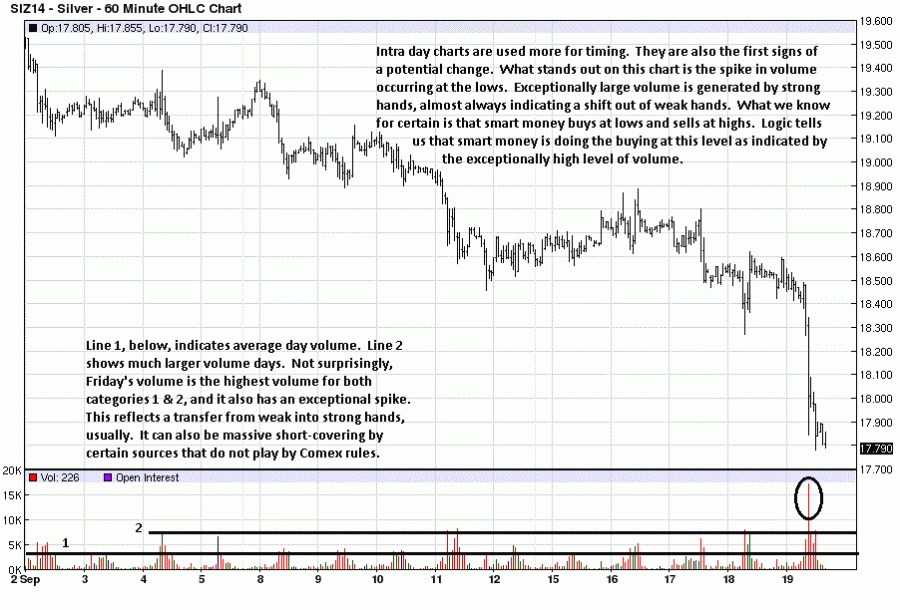
Trust us, a 60 minute chart is not going to overrule to strength of a weekly chart. What we want to see here is how the market looks in the aftermath of last week’s decline. The picture tells an interesting story not seen on the weekly or even the daily chart. What you have to understand is the role volume plays in any market. It is akin to the energy, or the lack of energy behind any market move.
When you see sharp volume increases, pay close attention for it is usually smart money making a move, preferably without being detected. Knowing how to read volume activity, an art more than not, the intent of the market movers becomes more apparent. We are all like minnows that can buy and sell without any impact on the market. Smart money has substantial position size that must be moved over a period of days, sometimes weeks so as to not impact the market and show their hand.
The first line, marked “1″ at the bottom of the chart, shows the average volume turnover on any given day. The second line, “2,” shows notable volume pick-up and should be viewed more closely because the large market movers are doing something without trying to tip their hand.
Then, there are the exceptional spike volume standout days, such as what occurred last Friday as silver descended to 4 year lows. Anytime there is such an extreme, count on it being a change from weak hands into strong hands. Here, weak-handed sellers and stops are being triggered, and it is strong hands that are buying, strong hands that generate the exceptionally high volume. The public does not have the ability to independently create such strong volume, rather, the public reacts to it, almost always to its detriment.
What the intra day market activity from last Friday does is create a need to focus very closely on HOW the market develops over the next several days. Notice has been served that something important just occurred. When silver activity is viewed along with what transpired in gold, at the same time, the potential for change becomes a higher probability, but one that must still be confirmed.
The market is “speaking” for those willing to pay attention.
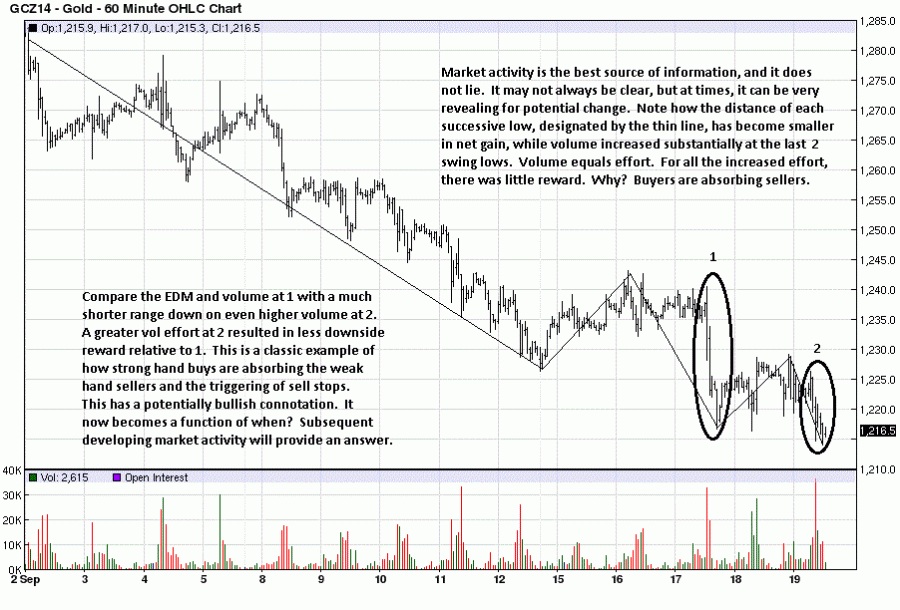
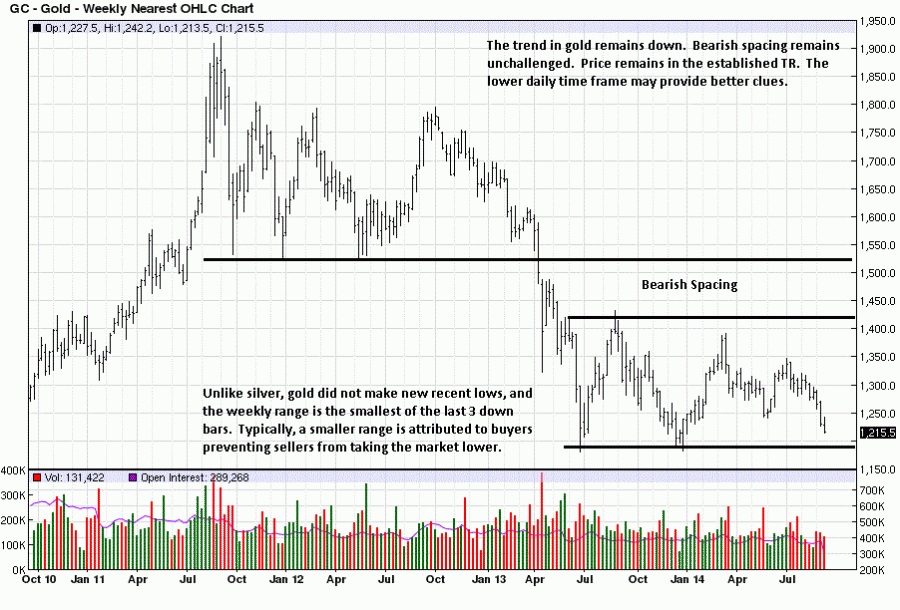
The standout difference between weekly gold and silver is that gold has not made a new recent low. In fact, gold did not even reach the TR support [Trading Range]. Is the market “speaking” here? Yes. In fact, it does all the time, the trend being its most important message for it tells everyone that the market momentum will persist in one direction for some undetermined length of time.
The market message we see is more at hand, and it is shown by the smaller TR from last week, compared to the two preceding weeks as the market has declined. The smaller range tells us that the downward momentum was stopped, to a degree, at a point in time where sellers have clearly been in control.
The fact that buyers prevented sellers from moving price lower than occurred does not mean the trend is changing, but it is a piece of information, just like in a jigsaw puzzle where one piece may not mean anything special, but when combined with a few other pieces interconnecting, a part of the puzzle become clearer.
A look at the daily chart may provide additional insight.
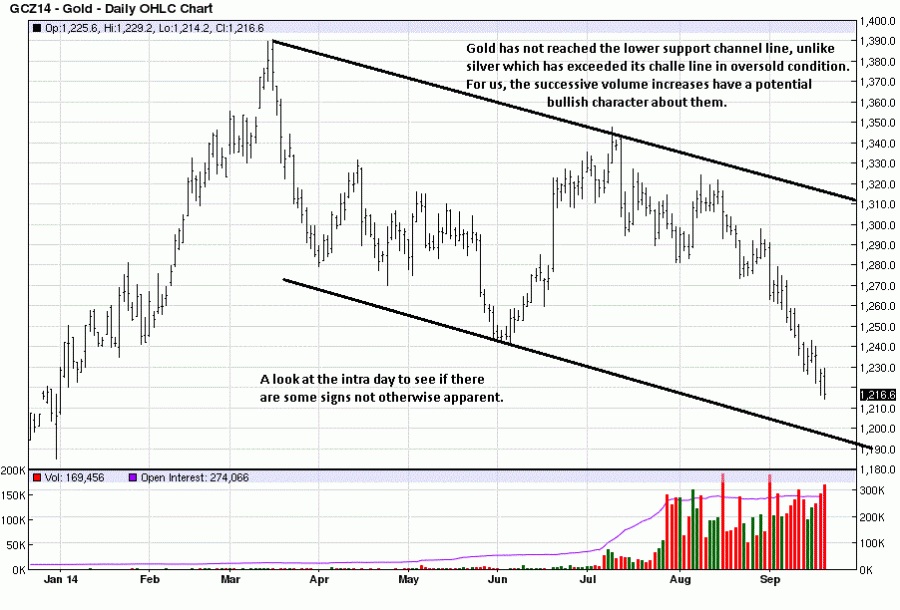
Within the same down channel as silver, gold did not even reach its lower support channel line, and that is a tribute to buyers for preventing sellers from exerting more influence with momentum on their side. We discussed how last week’s smaller range might be an important message, and the daily activity shows why.
Focus on the last 3 bars, all with red volume because each close was lower than the day preceding. The 3rd bar from the end was the widest range and lowest volume, and it tells us the there was Ease of Downward Movement [EDM], but the close was in the upper 3rd of the range, buyers winning the battle over sellers that day.
On the 2d bar from the right, volume increased, the bar range was smaller, and the close was near the high of the day, again, buyers are showing up and controlling sellers. Friday’s bar is the most interesting. Volume was second highest of the month. Increases in volume are usually attributable to smart money intervening, [which may account for why the prior two bars had higher closes; smart money trying to disguise their buying activity].
The question to be asked is, why did smart money increase the effort, via increased volume when price was at the low? It is not because they were selling into a hole, but more likely scooping up all the offerings from sellers and stops being triggered by the lower prices. Reading volume is an art form, and one can sometimes, even often, be wrong.
Maybe the intra day chart can add to the interpretation?
Indeed it does. The chart comments explain the set-up. Comparing the activity, [volume effort and extent of resulting price movement] between Wednesday and Friday confirms what was surmised on the daily chart read. Pay attention to these two days and what they mean for you will see this kind of activity repeat itself over and over in all markets and over all time frames. Frankly, most people do not know how to read charts, and that is why they offer opinions about what they think is happening instead of what the market is actually saying.
The volume effort from Friday is clearly higher than the volume effort from Wednesday, yet the EDM was much greater on Wednesday than it was on Friday. Here, you can see readily that strong hands were very active buyers on Friday, taking everything sellers had to offer, as well as all sell stops.
Will this mean a change in trend? No, but it could be an important step that leads to a change, if we see evidence that buyers are persistently putting in a greater effort than sellers. We need to be patient and wait for confirmation. Actually, there is no other choice. Those too impatient to wait for more confirmation are the ones who were more than likely selling out their longs on Wednesday and Friday from higher prices.
What does this mean for holders of the physical? More buying opportunities. What about those who bought at higher levels and have seen a “loss in value?” Ask yourself this question? Are you going to sell any of your holdings at these low levels? If no, then do not be bothered about where price is, unless you are buying more. One has not “lost” anything unless one sells. You have the best form of wealth preservation insurance for what is inevitable, and 5,000 years of history is on your side.
We have purchases of silver when priced at 47, and gold at 1,800. Is there any concern over having paid much higher prices? Not in the least. The reason for buying has not changed, and there was more buying of silver on Friday when price was just under 18. We practice what we preach.
It is wrong to focus on what one paid over the past few years as price peaked. It is necessary to look at the broader time frame. Those who have been buying silver since $4 and gold since $300 continue to do well. Keep in mind, a quarter made of 90% silver still buys a gallon of gas at today’s prices. When the price of PMs one day jumps a few hundred percentages overnight, as is likely to happen, those who paid top dollar for either metal will be overjoyed at their smart decision-making, although that is not currently how they feel.
The preference is for silver over gold, at this point where the ratio is around 68:1. In fact, in line with the previous article, Use Magic Of Gold/Silver Ratio, we are starting to look at switching some gold into silver. As a reminder, assume you exchange 10 oz of gold at 65:1, getting you 650 oz of silver. At some point in the future, the ratio may go under 35:1 or 30:1, and you switch back 650 oz of silver to gold at 40:1. You will then have 16 oz of gold, 60% more than previously held, all without risk, just by “playing the ratio.”
Steady the course PM holders. Add whenever possible.