Gold, Silver And US Dollar Updates With Review Of Latest COTS


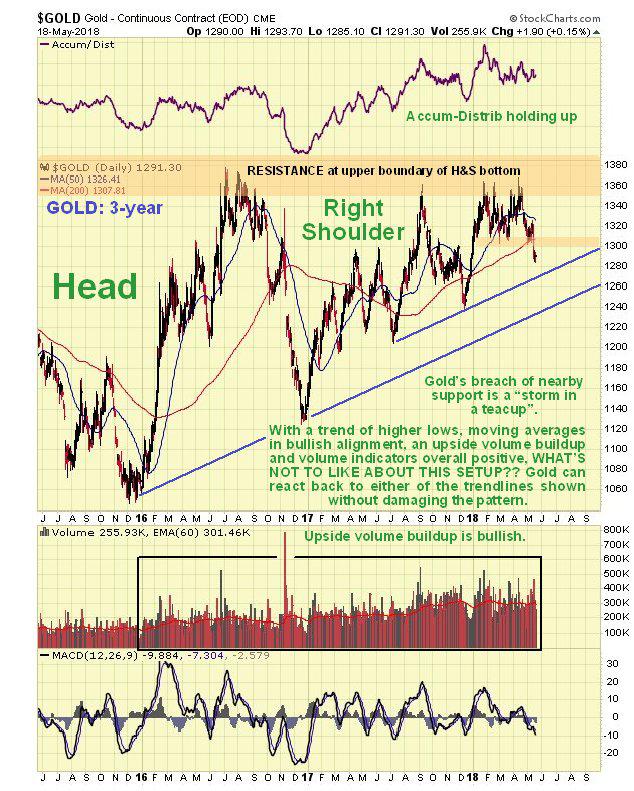
Gold’s breach of nearby support last week freaked out some longs of a nervous disposition. However, it did no technical damage of any significance, as we can see on our latest 3-year shown chart below on which we can observe that it is still above important supporting trendlines. This chart shows that last week’s drop was just a “storm in a teacup”. Recall that the pattern that has been forming since mid-2016, for nearly two years now, is the Right Shoulder of its giant Head-and-Shoulders bottom that may be viewed on the 8-year chart in the last Gold Market update.
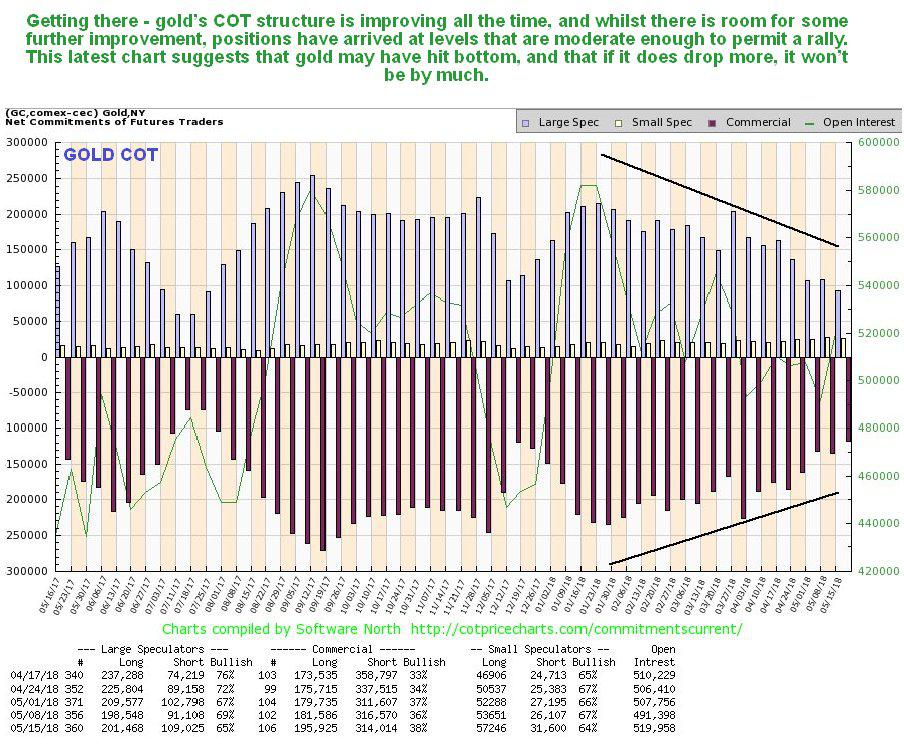
Last week’s drop actually improved gold’s technical condition by flushing out more jittery Large Specs, as we can see on its latest COT chart. Whilst there is room for further improvement, positions are now at levels that are moderate enough to permit a rally, which will happen if the dollar reverses here or soon.
Click on chart to popup a larger, clearer version.
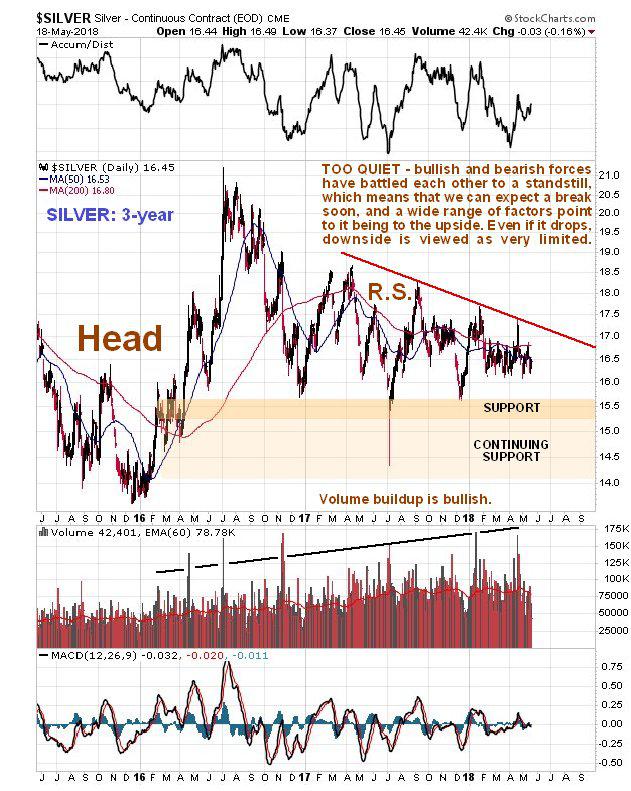
Turning to the 3-year chart for silver, we see that its technical condition is becoming extraordinarily tight, with fluctuations narrowing into a very tight range. This is a situation that must lead soon to a big move, and for a variety of reasons, that move is expected to be to the upside. Recall that the pattern that has been forming since mid-2016, for nearly two years now, is the Right Shoulder of its giant downsloping Head-and-Shoulders bottom that may be viewed on the 8-year chart in the last Silver Market update.
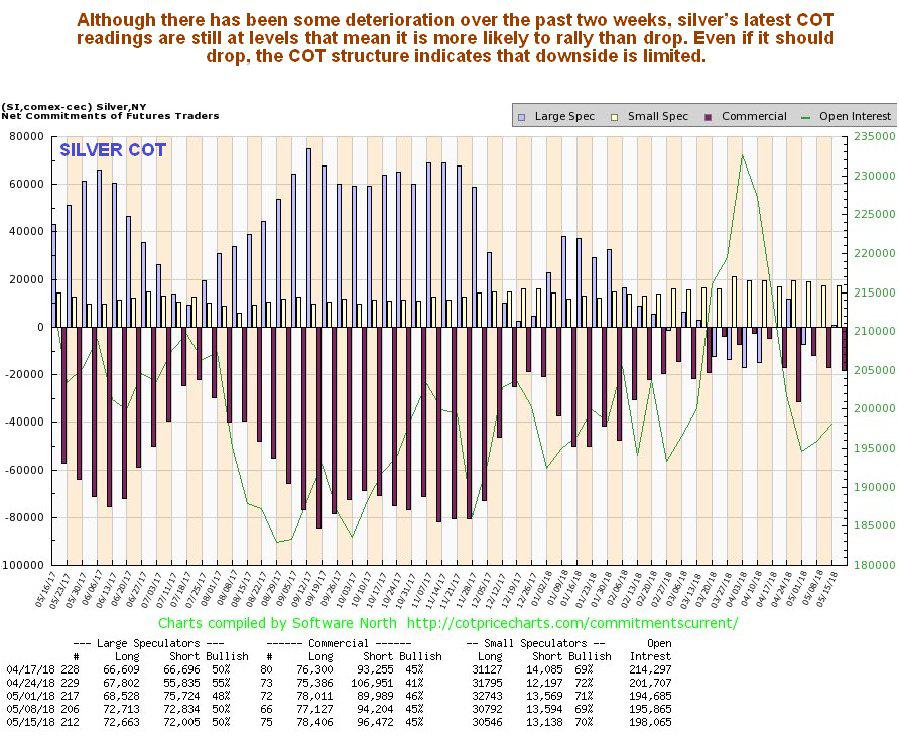
One important reason that silver’s next big move is expected to be to the upside is its COT structure, which is still more bullish than gold’s, with relatively low Commercial short positions and extremely low Large Spec long positions. Although this COT has deteriorated somewhat over the past two weeks, it remains strongly bullish.
Click on chart to popup a larger, clearer version.
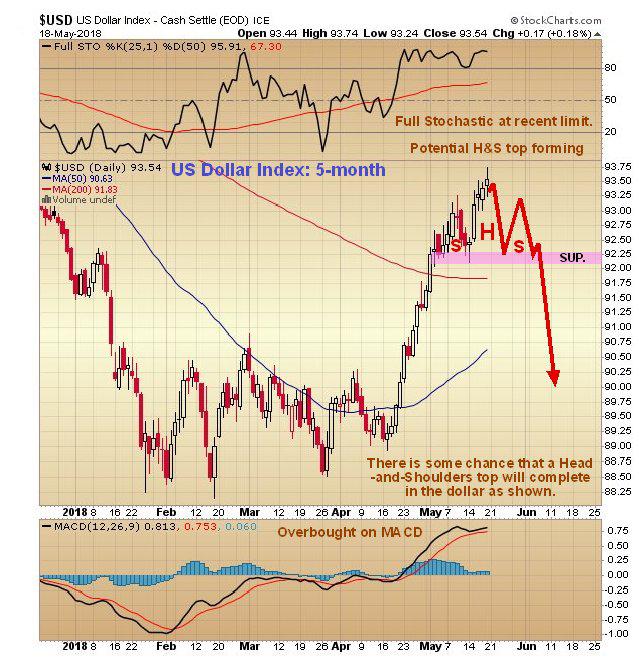
Even though gold and silver’s charts and COTs remain strongly bullish, as we have just seen, many are worried that the party will be ruined by a continuation of dollar strength, with it now being widely assumed that it will carry on ascending, so how does its latest chart look?
On the latest 5-month chart for the dollar index, we can start to see signs that its strong rally is running out of steam, with it starting to round over, having punched through its falling 200-day moving average, and one possibility, which is shown, is that it is at or very close to the high point of an intermediate Head-and-Shoulders top. This is an audacious call that could of course quickly be squelched by market action, but if should prove correct, then the Precious Metals sector should turn up here and gold and silver proceed to break out of their giant Head-and- Shoulders bottom patterns, as we have long been expecting, which will cause the PM sector to rocket higher.https://www.gold-eagle.com/sites/default/files/images2/maund052218-5.jpg

With regards to possible reasons why the dollar might reverse here we have some interesting news out of Europe in Brussels Rises In Revolt Against Washington. that, tired of being dictated to by Washington, in addition to not obeying Washington’s commands that it pull out of the nuclear treaty, it is taking steps to circumvent the use of the dollar when buying oil from Iran.
*********

Clive P. Maund’s interest in markets started when, as an aimless youth searching for direction in his mid-20’s, he inherited some money. Unfortunately it was not enough to live a utopian lifestyle as a playboy or retire very young. Therefore on the advice of his brother, he bought a load of British Petroleum stock, which promptly went up 20% in the space of a few weeks. Clive sold them at the top…which really fired his imagination. The prospect of being able to buy securities and sell them later at a higher price, and make money for doing little or no work was most attractive – and so the quest began, especially as he had been further stoked up by watching from the sidelines with a mixture of fascination and envy as fortunes were made in the roaring gold and silver bull market of the late 70’s.
Clive furthered his education in Technical Analysis or charting by ordering various good books from the US and by applying what he learned at work on an everyday basis. He also obtained the UK Society of Technical Analysts’ Diploma.
The years following 2005 saw the boom phase of the Gold and Silver bull market, until they peaked in late 2011. While there is ongoing debate about whether that was the final high, it is not believed to be because of the continuing global debasement of fiat currency. The bear market since 2011 is viewed as being very similar to the 2-year reaction in the mid-70’s, which was preceded by a powerful advance and was followed by a gigantic parabolic price ramp. Moreover, Precious Metals should come back into their own when the various asset bubbles elsewhere burst, which looks set to happen anytime soon.
Visit Clive at his website: CliveMaund.com


