Gold & Silver Continue Looking Strong


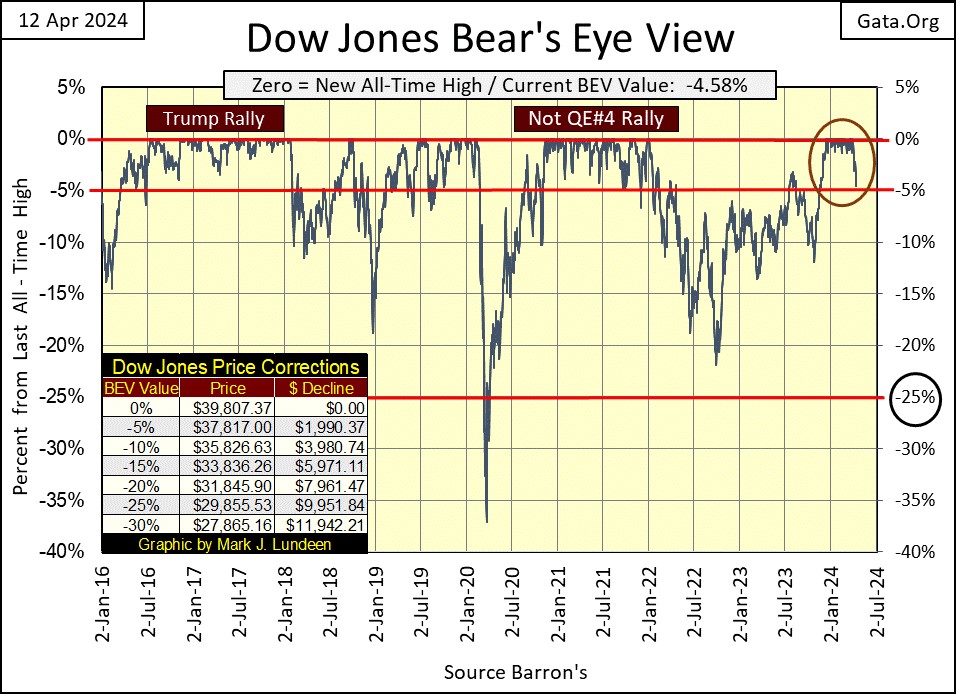
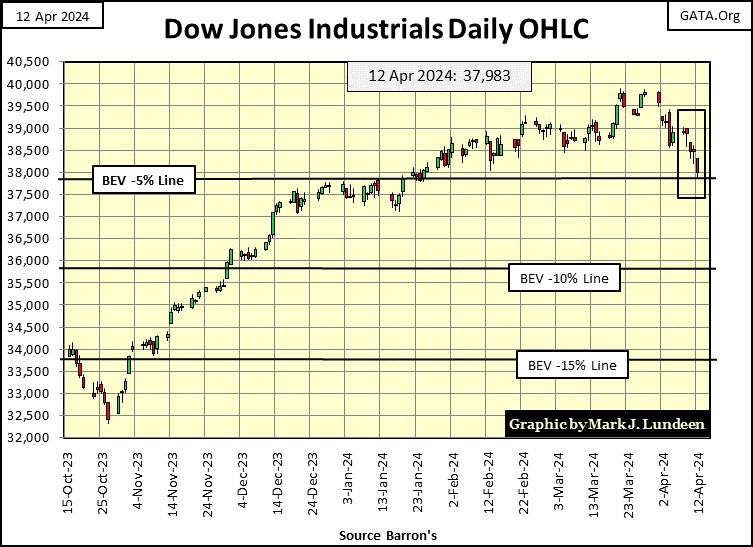
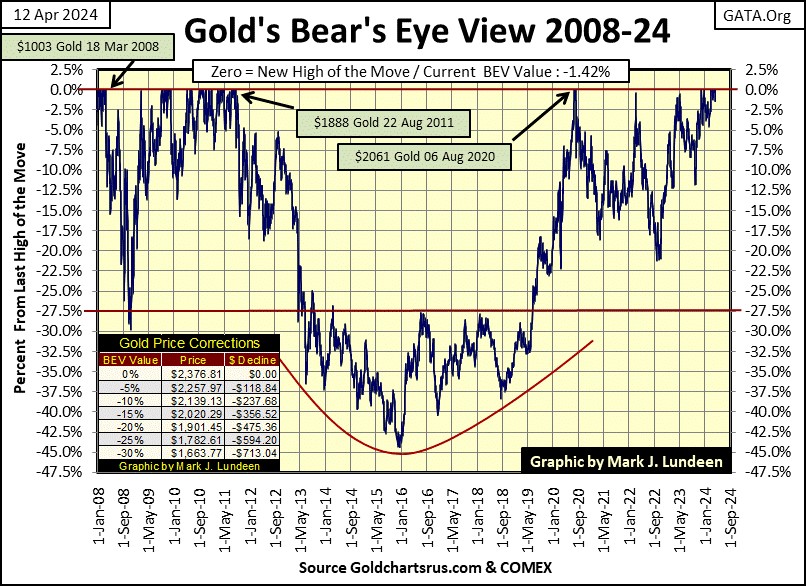
Two weeks ago, on the last trading day in March, the Dow Jones closed at a BEV Zero. In the following ten NYSE trading sessions, Mr Bear has almost knocked the Dow Jones out of scoring position, closing the week with a BEV of -4.58%.
What happens next is important; will the Dow Jones bounce off this low, and go on to new all-time highs? It could. It could also break below scoring position (BEVs -0.01% to -4.99%), and keep going down in the BEV chart below.
So, what should people do? Assuming we are all adults here, my advice would be to anyone with exposure to the stock market, to take some profits now. Maybe even get completely out of the stock market, hold some cash, if someone isn’t now inclined to invest in the gold and silver miners.
Looking at the news from the Middle East, things could get intense in the weeks and months to come. Wealth being the biggest chicken in the world. So, I wouldn’t be shocked seeing a big turndown; overwhelming selling in the market should something happen between Israel and Iran. That isn’t a prediction, I’m just considering the possibilities confronting the market now in April 2024.
Of course, gold being gold, and silver being silver, I wouldn’t be surprised seeing the old monetary metals doing the exact opposite on the same news, should it in fact become a reality.
Note: The above was written on Friday night. By Saturday night Iran did attack Israel. I’m looking forward to Sunday night to see how this news is taken by the markets. Next week may see some big moves.
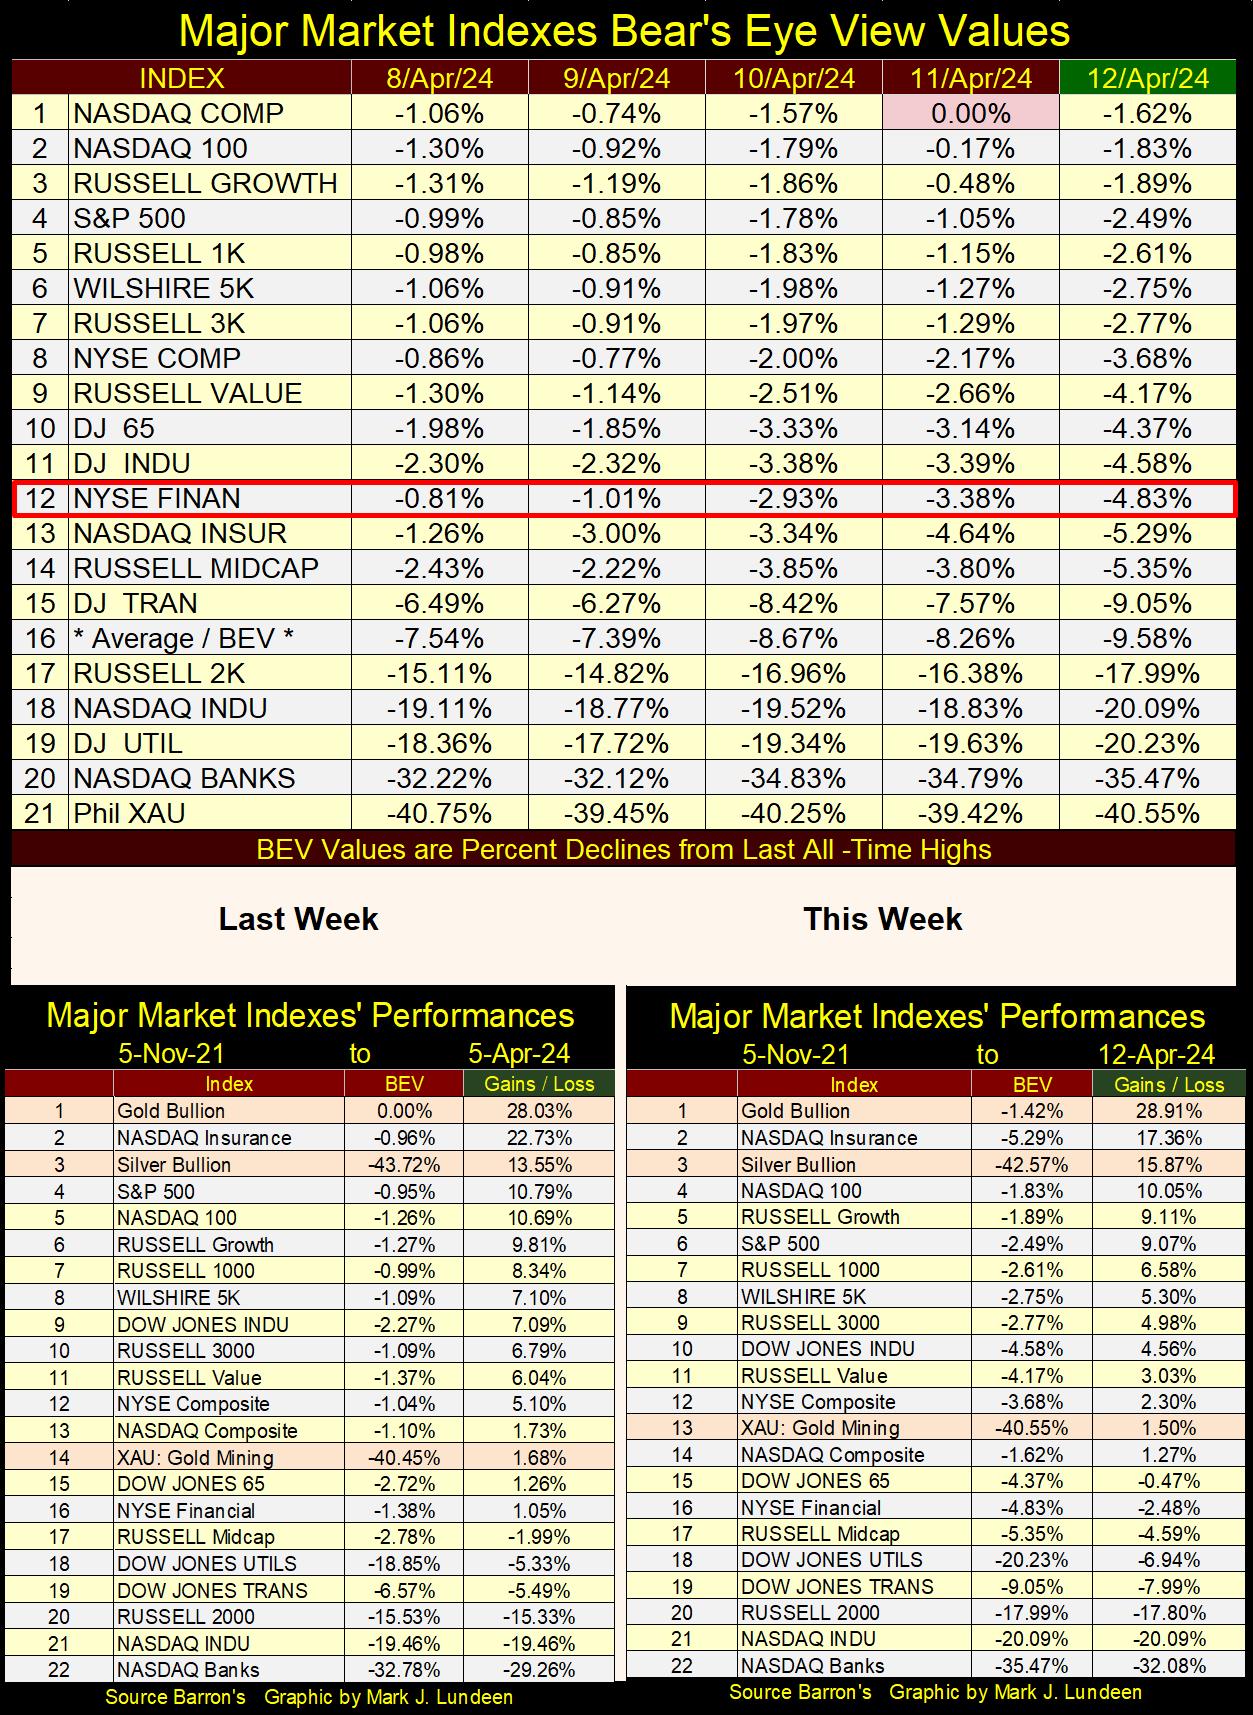
Here are the BEV values for the major market indexes I follow below. Only one BEV Zero this week, which is better than last week, which had no BEV Zeros.
I highlighted the NYSE Financial Index this week (#12), which deflated by 4.02 BEV points, from Monday’s to Friday’s close. Right below that at #13, is the NASDAQ Insurance Index, an index that’s been a top performer for a long time, but not this week. And then there is the NASDAQ Banking Index (#20), closing at the lows of the week.
It makes me nervous whenever the financial indexes are down big. That is especially so when the stock market is near a market top, as this market has been for quite a while.
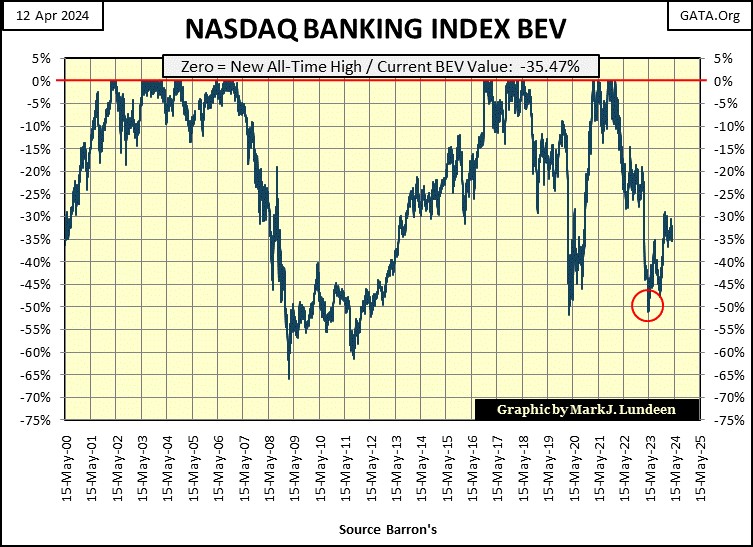
Next is my Bear’s Eye View of the NASDAQ Banking Index. A few weeks ago, it attempted to break above its BEV -30% line. This week this banking index closed below its BEV -35% line. I don’t know what it will do in the weeks to come, but should it close below its lows of last May (Red Circle), below its BEV -50% line, I believe there will be big problems, now hidden, rising to the surface, and for not just for the banks.
In the performance tables above, not much has changed for gold and silver. The XAU advanced by a row this week. So, for a week where most of everything else was down, precious metal assets held their own, or advanced a bit.
Before this bear market in financial assets is over, speaking of stocks and bonds, I believe rising interest rates and bond yields will become one of its signature features. Why would that be? Because when Alan Greenspan became FOMC Primate Idiot (August 1987 to March 2006), the FOMC has recklessly manipulated the cost of money (rates and yields) down to dangerous levels, inflating huge bubbles in the financial system in the process.
Below is a chart for the US Treasury’s long bond yield for the past seventy-two years. Why did long T-bond yields rise to double-digits in the early 1980s, and then crash down to below 1.5% in 2020? To make a very long story short, in 1913, American bankers and politicians got together, and created the Federal Reserve System.
And exactly what does the Federal Reserve System do? You are seeing one of things they do in the chart below; manipulate bond yields and interest rates to absurdly lower levels, ultimately for no good purpose.
Now comes payback time, via rising rates and yields, and deflating bond valuations.
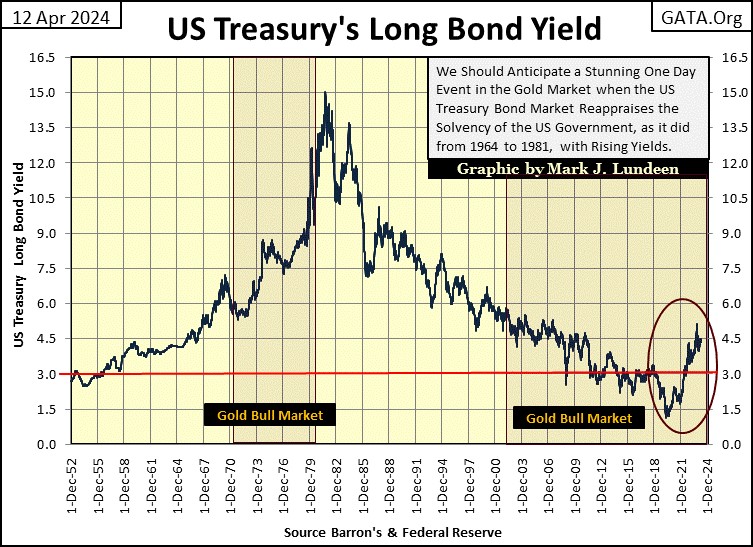
Oh, note above what bond yields were doing in the first gold bull market (1970 to 1980); that’s right – they increased to double-digits in the Treasury, and corporate bond markets. Why would that be? Because during this decade, CPI inflation was also rising towards double digits, making fixed-income investments, like bonds a mug’s game, while gold and silver, the old monetary metals became the best game in town.
Are bonds once again a mug’s game? I believe they are, though most “market experts” would disagree with that. Case in point is this 30Yr T-bond, issued in February 2020. From its coupon of 2% in February 2020, six months later (August) its current yield (Red Plot) had declined to a puny 1.19%, as its valuation (Blue Plot) increased by 20%.
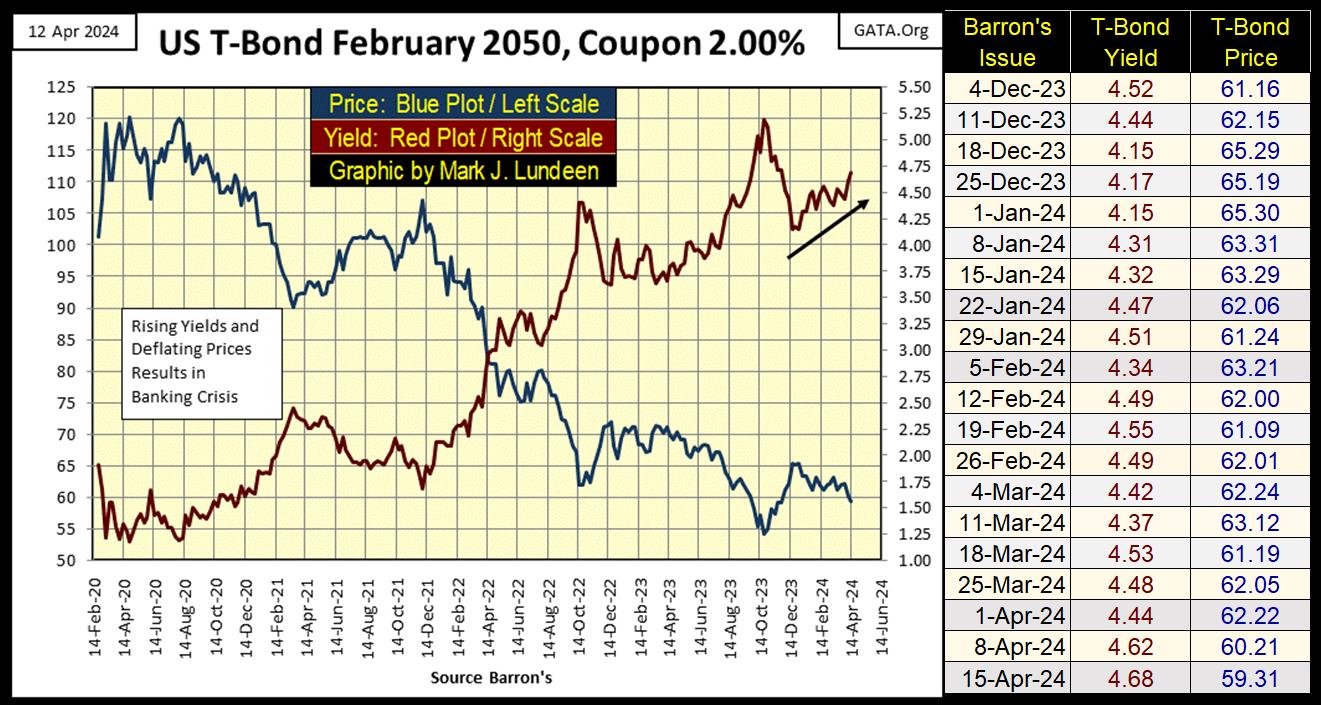
I believe August 2020, will prove to be the top to a bull market in bonds that began in October 1981, when the long T-bond yielded over 15%.
Since August 2020, yields have relentlessly climbed higher, as valuations have deflated, in a way a T-bond’s valuation should never do. From its high in August 2020, this bond closed the week with its valuation down by 50%. For an investment intended for widows and orphans, and bank reserves, that is a serious loss, that will only get worse when bond yields once again begin to rise.
Another thing to consider when looking at the T-bond above; we’re looking at a small portion of the US national debt, which at week’s close was at $34.55 trillion dollars. Though I suspect most of the national debt is issued in debt maturing in ten years or less, so it hasn’t been impacted by rising yields as much as this 30Yr bond has been. But yields have been rising in the bond market, which deflates bond valuations. I wonder how much less the current market cap for the Treasury Bond Market is, compared to the $34.55 trillion dollar national?
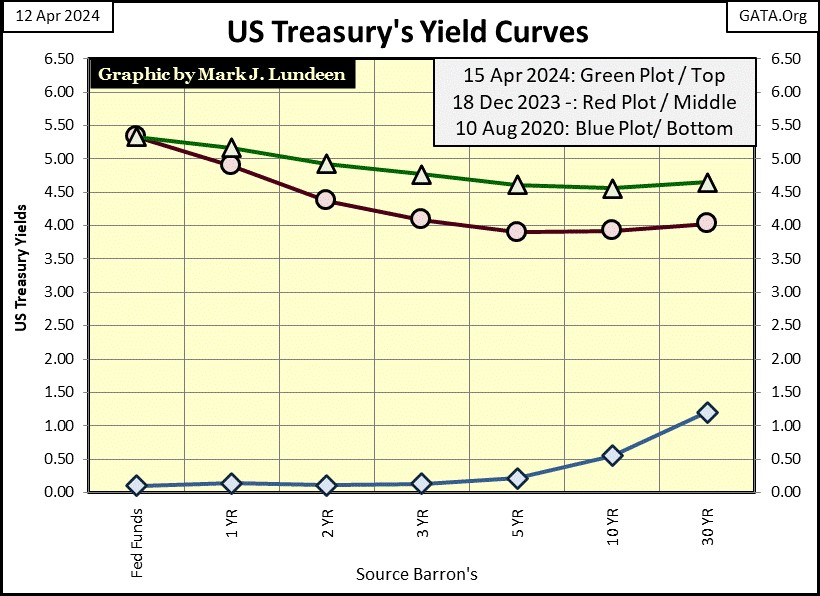
Keeping that in mind, let’s look at the yield curve below. The blue plot is from Barron’s 10 August 2020 issue, the top of the 1981 to 2020 bull market in Treasury debt, which is also the bottom in T-bond yields. The 10Yr T-bond then was yielding a little less than 50 basis points, a half of a percentage point. “Market experts” and economists at the time thought little of this, that one had to go out 20 years, or more to earn 1% in the Treasury market.
Four years ago, there was considerable speculation the Treasury market would follow the European example, and they too would soon be yielding negative yields. Though no one ever answered my question of how that was possible, how any fixed-income instrument that paid out a coupon, could ever yield a negative return?
But that was then (Blue Plot below), and this is now (Green & Red Plots), and what a difference forty-four months can make.
If you look at the bond yields in the charts above, last December was a low in a correction in bond yields, and yields have been rising since. Not fast, but for the bulls in the debt markets, yields have been trending the wrong way for the past four months.
Also, the yield curve is inverted; the Fed Funds Rate is higher than longer term debt, and this has been true since November 2022. When the idiots at the FOMC invert the yield curve, typically one should expect a downturn in the stock market. But that didn’t happen this time. The Dow Jones was trading around 30,000 in November 2022 when the yield curve first became inverted, to just under 40,000 two weeks ago, all while the yield curve was inverted. Odd, very odd.
The FOMC is promising some rate cuts in the coming year, which would result in their Fed Funds Rate falling below the longer-term T-debt yields seen above. That would “stimulate” the economy, as well as CPI inflation. But note; should longer-term T-debt continue rising, to values above the current 5.33% for Fed Funds, the idiots may be forced to actually increase their Fed Funds Rate to keep things as they are for now.
What will the idots from the FOMC do with their “monetary policy” in the coming months? Like the FOMC idiots themselves, I haven’t a clue.
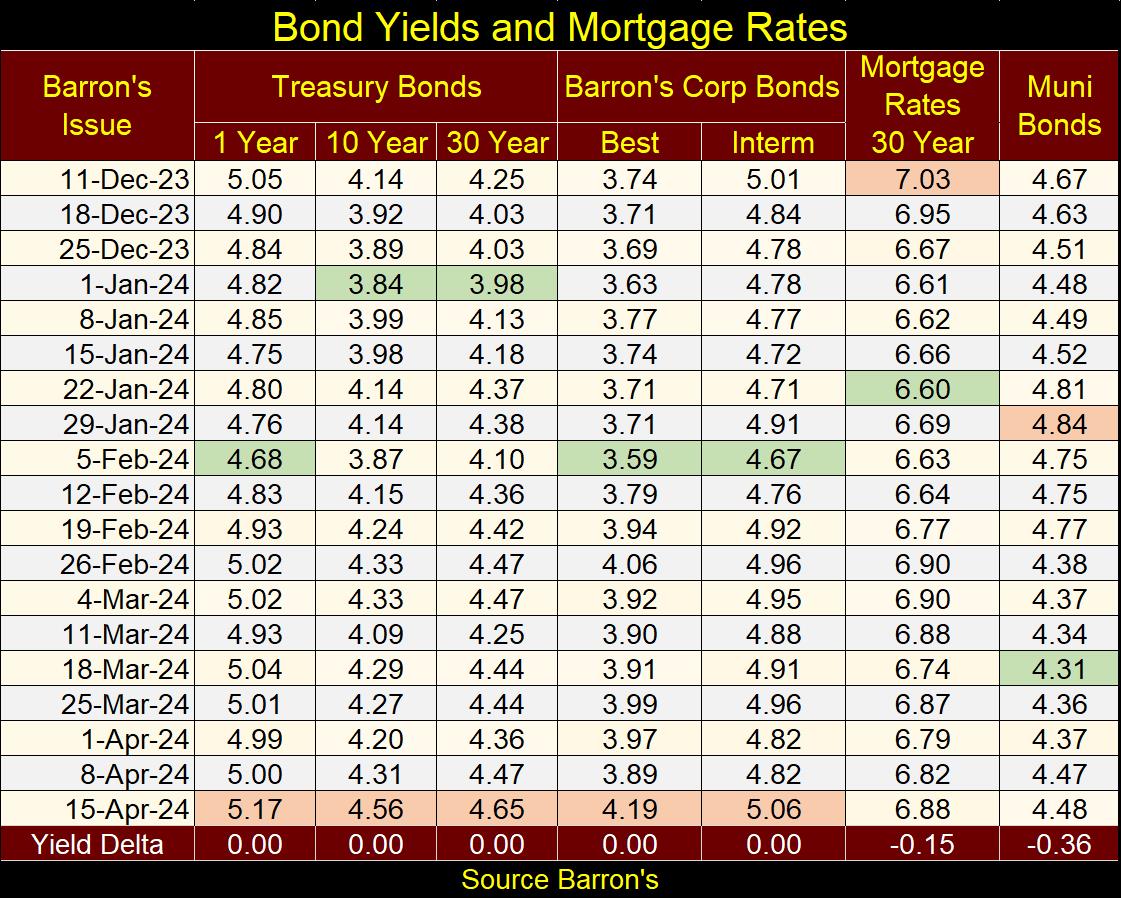
Something I do have a clue about, is that bond yields are rising. Below is a table listing the weekly values for some T-bond, Barron’s Corp Bond yields, Muni Bond yields and mortgage rates for the past four months. Within these ranges, yield lows are in green, and yield highs are in light red.
Note the T-bond and Barron’s Corporate bond yields closed the week at four month highs. This is a very bearish trend for the financial markets, should it continue, which I believe it will.
With this background on the bond market above, lets now look at the Dow Jones in daily bars below. The last two weeks have been hard on the bulls. I thought 40,000 on the Dow Jones was a done deal three weeks ago. It may still happen in the weeks to come. The Dow Jones hasn’t yet fallen below its BEV -5% line, and until it does, I’m going to remain positive on the stock market. But being positive on the stock market, doesn’t mean I think the stock market is a buy – it’s not.
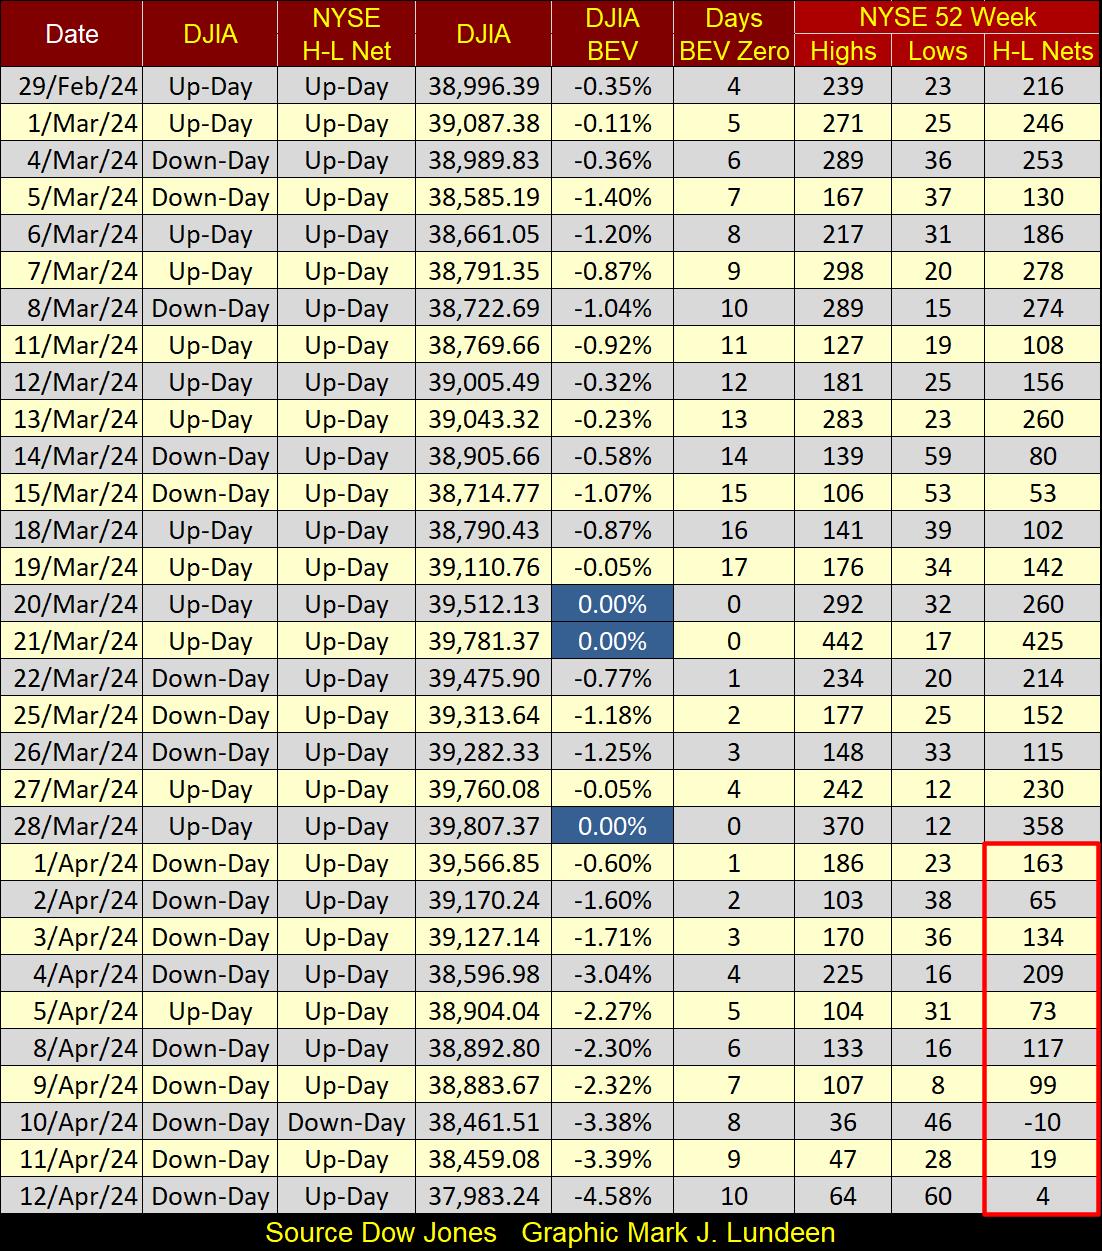
Here is my table for NYSE 52Wk High – Low Nets. Since the Dow Jones last all-time high on March 28th, the NYSE has seen a decrease in its 52Wk highs. On Wednesday this week, the NYSE actually saw more 52Wk lows than highs. Is this a sign of things to come? Not necessarily, but who knows?
Let’s look at gold’s BEV chart next. Since gold first went into scoring position last November, it saw only two BEV Zeros in December, after which gold then became a new all-time high free zone until March 3rd. Since early March, gold has seen sixteen additional BEV Zeros, for a total of eighteen since it entered scoring position in November, making the past six weeks for gold a very hot market.
Will gold, and silver continue being hot markets as summer approaches? For a lot of reasons, I believe they will. Two being the rising levels of chaos in the Middle East, and rising bond yields.
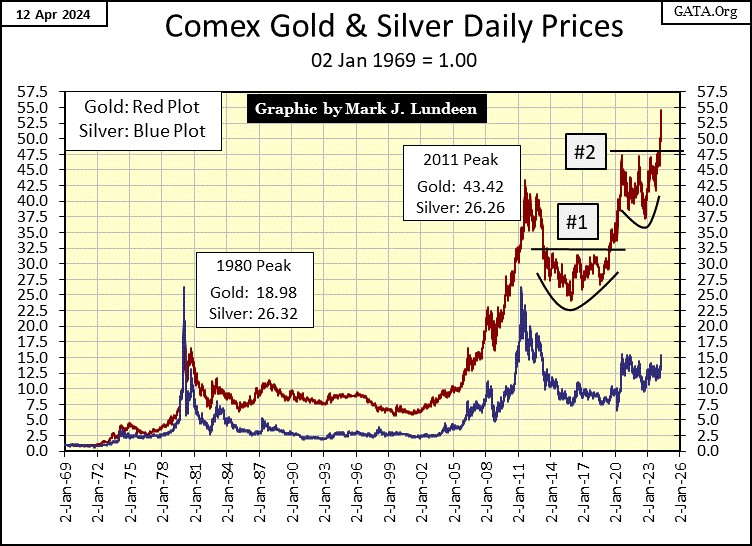
This week, gold almost took out $2400 (55 on chart below), and silver closed the week above 15 ($27.97). In the silver market, things should become exciting when it closes above its 17.5 level in the chart below ($32.40).
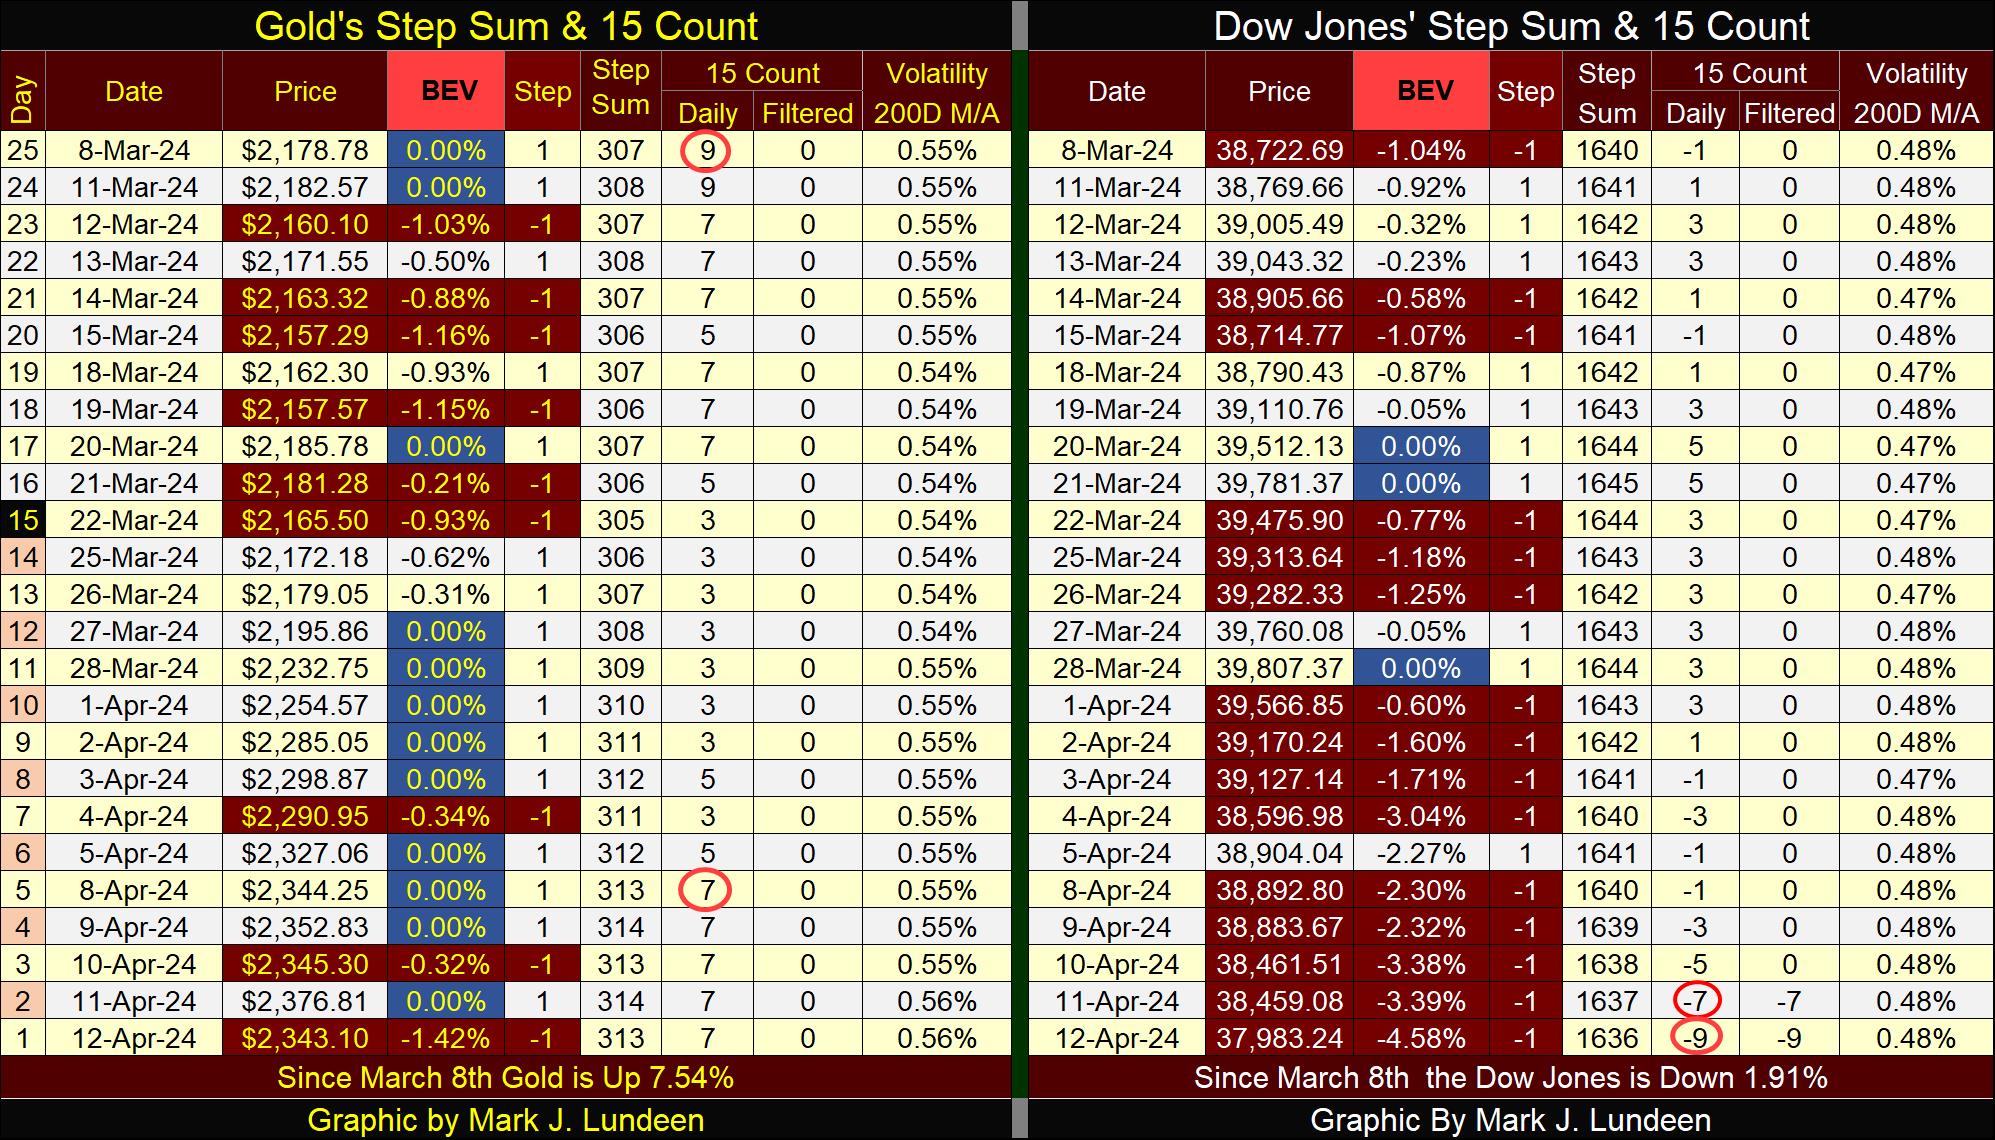
Gold in its step sum table below is looking really good. I love seeing all of those blue BEV Zeros (new all-time highs) in the price of gold. The step sum is up by six since early March, meaning gold is seeing many more daily advances than declines. Gold has been doing exactly that for a while. Its 15-count on March 8th was a +9, or on this day’s sample of fifteen trading days, twelve were advancing days, and only three were declining.
A +9 is a very overbought market, and markets don’t like being overbought. So, following a +9, one would expect a selloff in the gold market. And in fact, gold did see an increase in daily declines, but these daily declines didn’t take the price of gold down much. Soon, gold was making new BEV Zeros, and now we wait to see what next week brings.
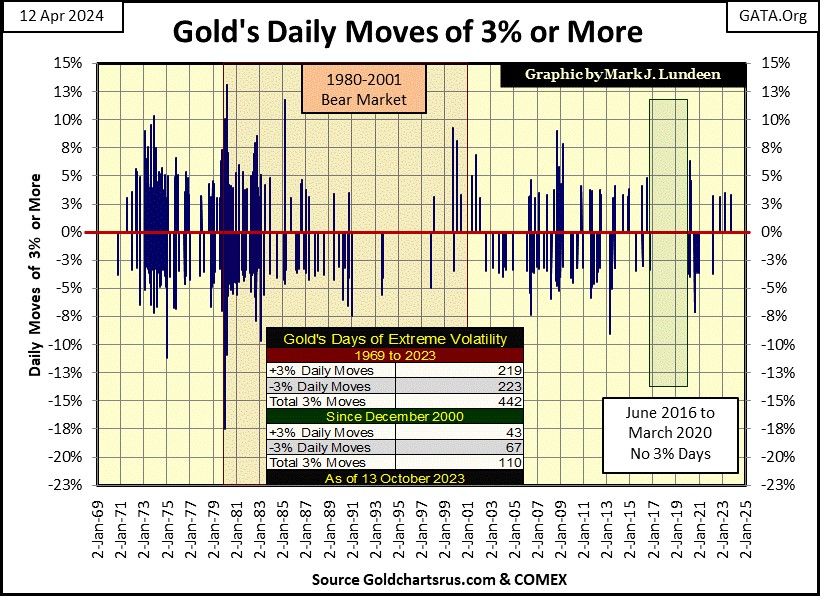
Gold’s daily volatility’s 200D M/A closed the week at 0.56%. Not a big increase in daily volatility, but a move in the right direction. Next is a chart plotting every day of extreme volatility; gold 3% days, since 1969. During the 1970 to 1980 bull market in gold, daily moves of +/- 5%, or more weren’t uncommon. With gold now trading over $2,300, a 5% daily advance would be a one day gain in the price of gold of $115.
Is that possible? Look at the chart below, and you tell me why daily advances of 5% or more isn’t possible. That a cluster of gold 3% days hasn’t yet formed in our current bull market in gold (2001 to 2024), is because the money needed to make that happen is still circulating in the stock and bond markets, and has been for decades.
Sometime in the not-too-distant future, deflation in the financial markets will once again force wealth to flee the stock and bond markets, on a quest to find inflation somewhere in the universe of investments, a safe harbor for wealth in the coming storm.
In the past, gold and silver did exactly that, and I believe it will do so again. We’ll be able to see exactly when this shift in funds is beginning to happen, as days of extreme market volatility; 3% days become common market events in the gold market.
Moving to the Dow Jones side of the step sum table above, the Dow Jones’ 15-count closed the week with a -9, making the stock market very oversold. Markets don’t like being very oversold, so maybe we’re approaching a short-term bottom here. A pending bounce in the Dow Jones that could keep it in scoring position for a while yet, and possibly, a few new BEV Zeros too.
Mark J. Lundeen
********


