Gold, Silver & Oil Special Trading Report


Gold & Silver Report
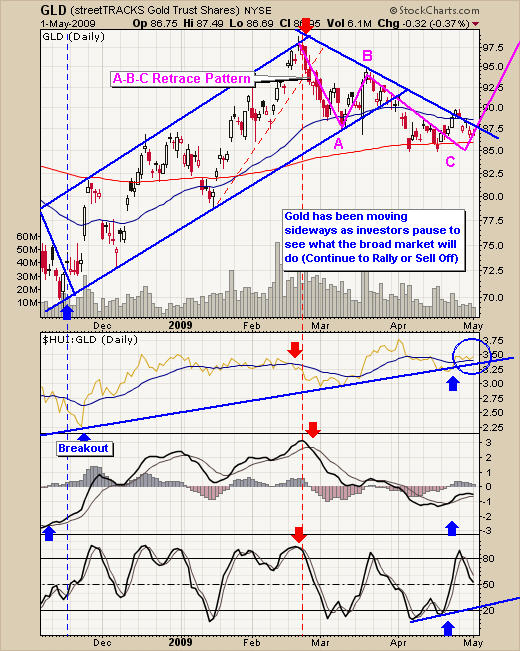
Gold and silver have been making a nice controlled pullback since their high in February. With precious metal prices drifting lower making clean looking waves like these it's generally a sign of profit taking before another move higher.
In my opinion the broad market is over bought and has been for about 2 weeks. With most sectors Bullish Percent Charts at levels of previous intermediate tops (4-6 week cycles) it's important that we tighten our stops on current trades and be ready for playing the down side for broad market equities.
When the board market starts to slide I expect to see money move into gold, silver and precious metals stocks. I do not think we will see a huge slide in prices for the DOW and SP500 but it's very likely we could see prices pull back 10-15% from these current levels.
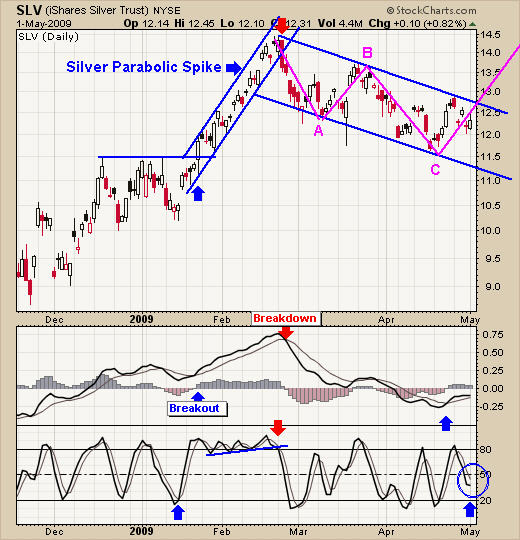
When people start to panic and worry about prices dropping again, money will start to flow back into gold and silver. Both of these metals are great to trade but I would like to note that silver is not as widely owned as gold, so it tends to move a little more freely. When money moves in, it surges higher and when money is pulled out of the metal it drops like a rock.
Silver Bullion ETF (SLV)
Gold & Silver Trading Conclusion
Trading these metals has been more difficult the past few months due to volatility. It looks as though the markets are starting to settle down. Currently gold and silver are trading in the mid to upper area of their resistance trend lines which means buying at this level carries much higher risk if the trade is to turn and go against you.
Knowing when to exit a trade your trade is one of the most difficult tasks of trading and the part 97% of traders do not do correctly. Protecting your money and or gains is critical. Many times I will exit trades at break even and try again on another setup instead of watching a small winning traded turn into a losing trade.
That being said those of you who are buying at these levels be sure you know your exit points and stick to them. I'm expecting a big move in gold and silver but it could go either way. If you would like to receive my weekly trading reports with buy and sell signals please visit my website: www.GoldAndOilGuy.com
The Oil Report
The energy sector has been beaten down hard over the past 8 months. Since November it looks like it has been bouncing along the bottom with investors buying on the dips when dividends are high and prices are dirt cheap for many solid companies.
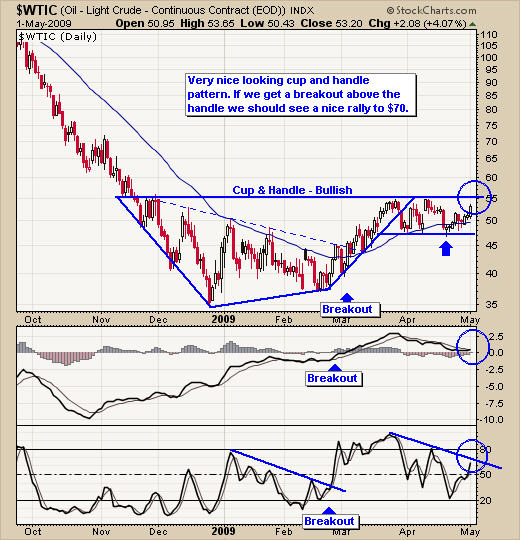
I must point out that the broad market and energy stocks look over bought and ready for a sharp pullback any day now. But if oil breaks out above $55 and starts rallying higher energy stocks will follow suit. Keeping our eye on crude oil prices is key here.
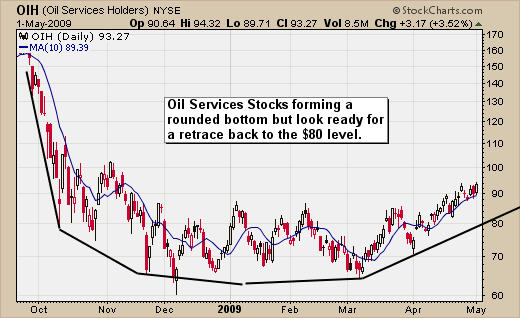
Oil Services Stocks Forming a Rounded Bottom Pattern
Light Crude Oil Trading Chart
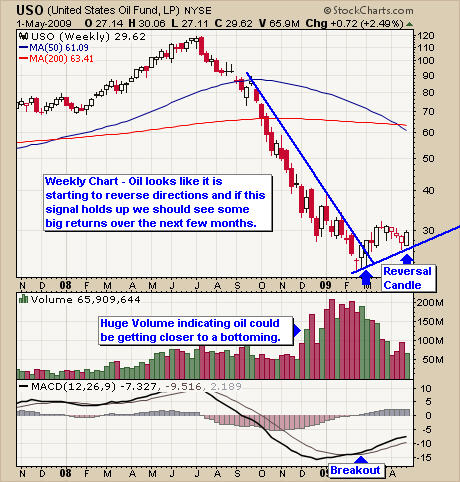
Weekly Reversal Signal
This Oil Fund has created an intermediate buy signal as of Friday's close. It appears the price action for this fund is signaling a reversal. The long lower candle wick which was formed two weeks ago touched our support trend line and rallied strong into the close.
Then last weeks move higher completed the reversal candle. Risk for entering this trade is about 11% if you set your stop below the support trend line. I only focus on the daily charts and enter trades with 3% or less risk.
USO Crude Oil Trading ETF
Oil Trading Conclusion
Oil and energy stocks look to be forming a bottom which is a great sign for oil and other energy products like natural gas.
Oil service stocks have been climbing for several weeks and look ready for some type of pullback. It could be a sideways move or a quick 2-3 day drop.
Crude oil prices continue to hold a solid cup & handle pattern as we wait to see which way prices will breakout. Waiting for a low risk setup in our trading funds is difficult but it must be done to keep our risk: reward ratio in line.
I posted a weekly chart of the USO Texas Oil fund because many you trade this. This weekly chart looks very bullish because over the past two weeks we have had a reversal pattern form. This type of setup is for longer term traders who carry more risk and provide more time for trades to mature.

Chris Vermeulen has been involved in the markets since 1997 and is the founder of Technical Traders Ltd. He is an internationally recognized technical analyst, trader, and is the author of the book: 7 Steps to Win With Logic
Through years of research, trading and helping individual traders around the world. He learned that many traders have great trading ideas, but they lack one thing, they struggle to execute trades in a systematic way for consistent results. Chris helps educate traders with a three-hour video course that can change your trading results for the better.
His mission is to help his clients boost their trading performance while reducing market exposure and portfolio volatility.
He is a regular speaker on HoweStreet.com, and the FinancialSurvivorNetwork radio shows. Chris was also featured on the cover of AmalgaTrader Magazine, and contributes articles to several financial hubs like MoneyShow.com.


