Gold? Silver Stocks? Which Is the First Domino to Fall?


The markets did little yesterday, but it doesn’t mean that we have no signals right now. Conversely, there are plenty.
I covered many of them in my previous Gold Trading Alerts, and today, I’d like to focus on the resistance levels that were just reached not only in GDX and GDXJ, but also in other proxies for mining stocks – even in case of the junior silver stocks
Mining Stocks at a Critical Crossroad
That’s right – even the SILJ ETF moved to a critical resistance level where previous medium-term rallies ended.
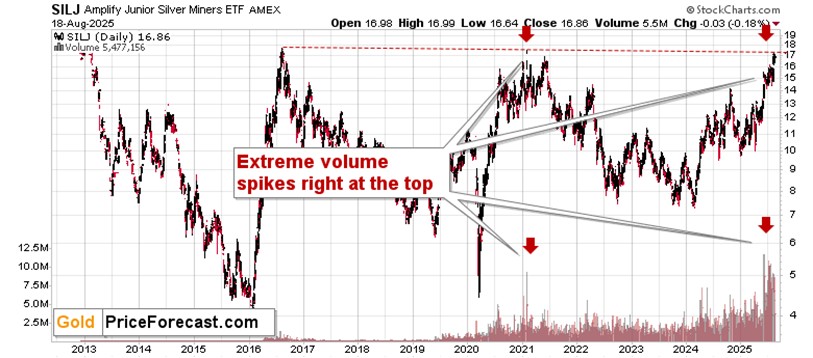
That’s where the rally ended in 2016, and that’s where it ended in 2021. The history rhymes – silver topped at these levels so – unless we see a confirmed breakout – we’re likely to see another slide sooner rather than later.
Especially that we already saw a sudden increase in volume levels – exactly what confirmed the end of the rally in 2021. When you think about it, it makes perfect sense. People’s emotions move to extreme levels at market tops, and that’s also when people are most motivated to buy – that’s what the huge volume represents.
If we saw something like that in silver junior miners, we might shrug it off. But we see something like this in GDX, GDXJ, and even in the XAU Index – proxy for both: gold stocks and silver stocks.
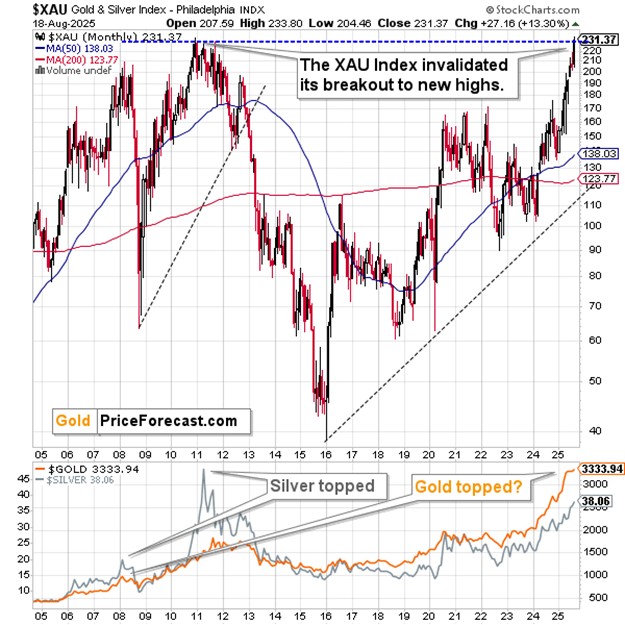
In this case, miners are testing their all-time 2011 high. The XAU Index was just above this level, and then it moved back below it. There’s a name of this kind of action - it’s invalidation, and it’s a sell signal.
Interestingly, the 2011 top was a breakout above the 2008 top, which was invalidated and then followed by a huge decline in the following months and years.
Again, is this time different? Sure, some miners have bullish potential (and some the opposite), but overall, we’re at the same price levels – at a super-strong, long-term resistance.
If the situation is indeed different, then why are we seeing strength in miners vs. gold after a rally – something that we saw right at the 2011 top?
And why is gold already breaking lower?
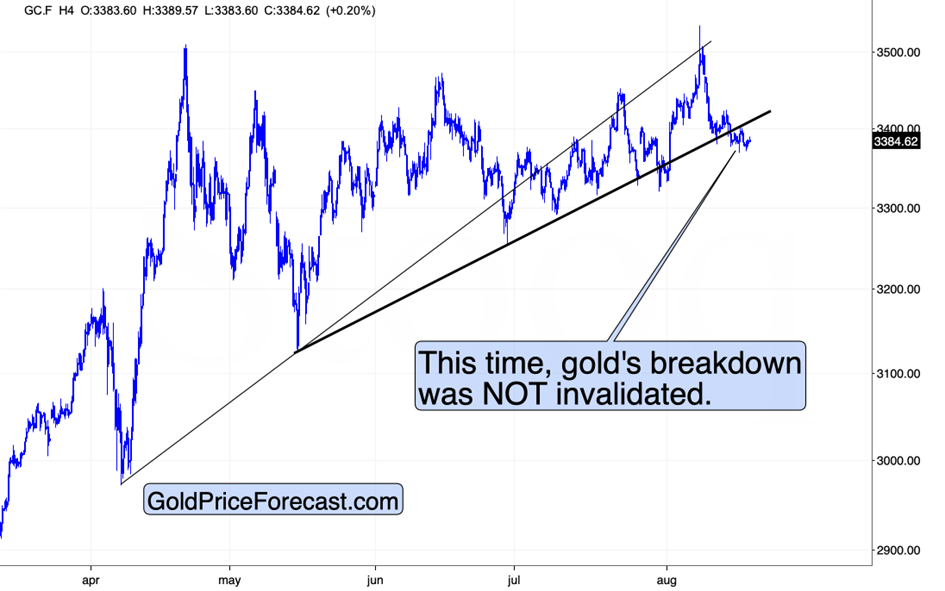
Precisely, gold just verified the breakdown below its rising, thick support line by moving back to it and then lower again. Back in late-July, gold futures were unable to confirm this breakdown, but not it’s the opposite – we just got this important sell signal.
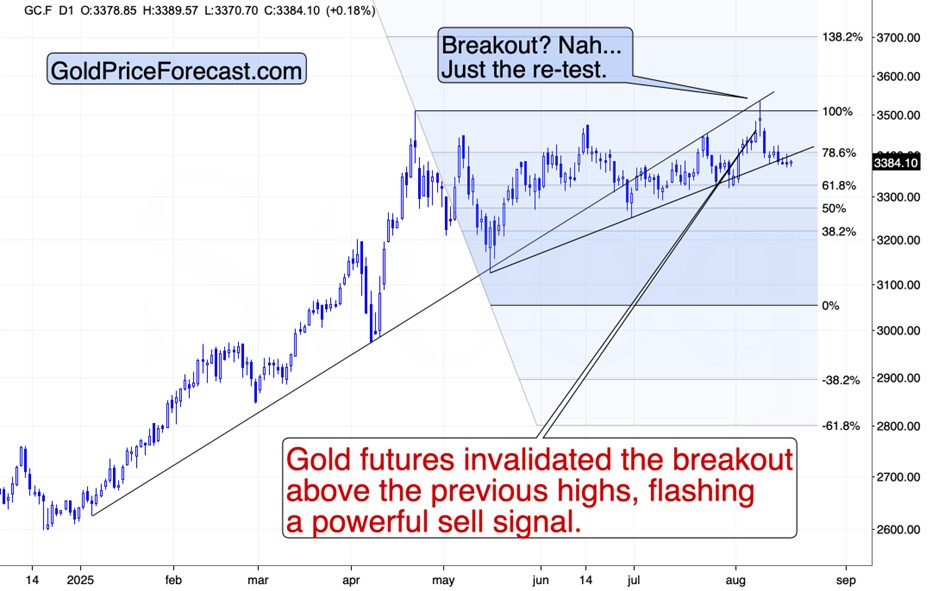
Today will – most likely – be the third consecutive daily close below this line, which will fully confirm the breakdown. Obviously, that’s bearish.
After a bigger decline, there might be an opportunity to go long gold, but we’re not there yet, in my view.
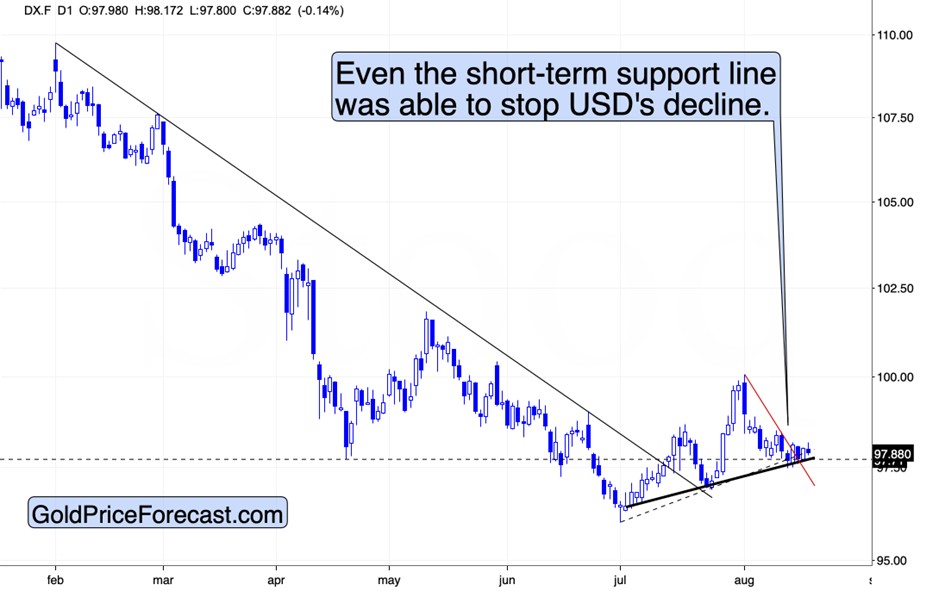
The U.S. Dollar Is the Missing Trigger
The USD Index continues to do nothing, but that nothing has a powerful bullish bias.
The reason is that the USD Index is after a medium-term breakout, and the last month of trading is a post-breakout consolidation. The rising short-term support line held, and right now the USDX is after a short-term breakout above its declining red resistance line.
All this means that the USD Index is ready to move higher – likely much higher in tune with its positive fundamentals (tariffs are bullish for the U.S. dollar). This would likely serve as the missing trigger for the declines in the precious metals sector.
Please note that copper is already declining – in tune with my yesterday’s comments:
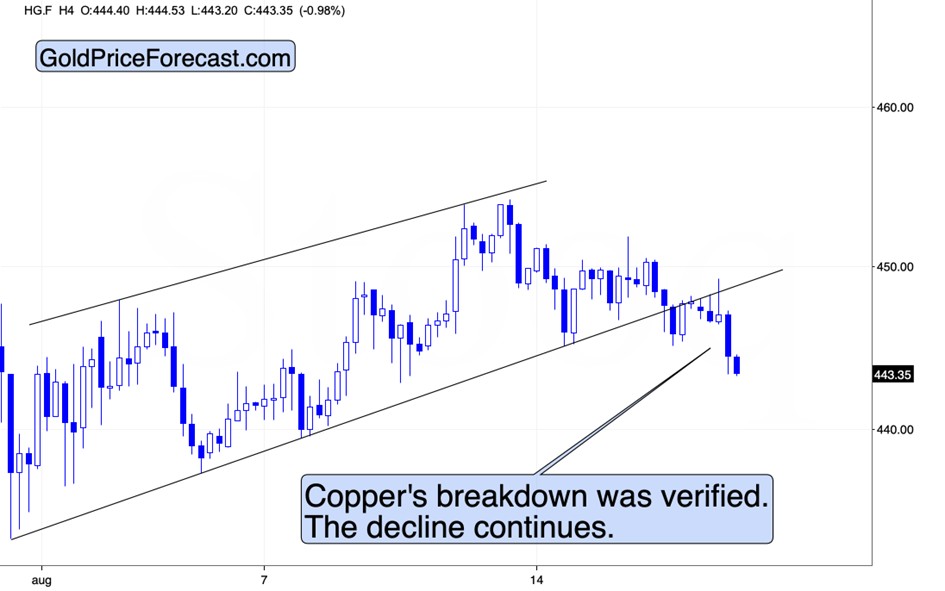
The chart above features a small breakdown in copper. Insignificant? Perhaps, but it’s still a breakdown that we see after three other attempts to move below this line. The situation is already different here.
Why would this short-term breakdown be important?
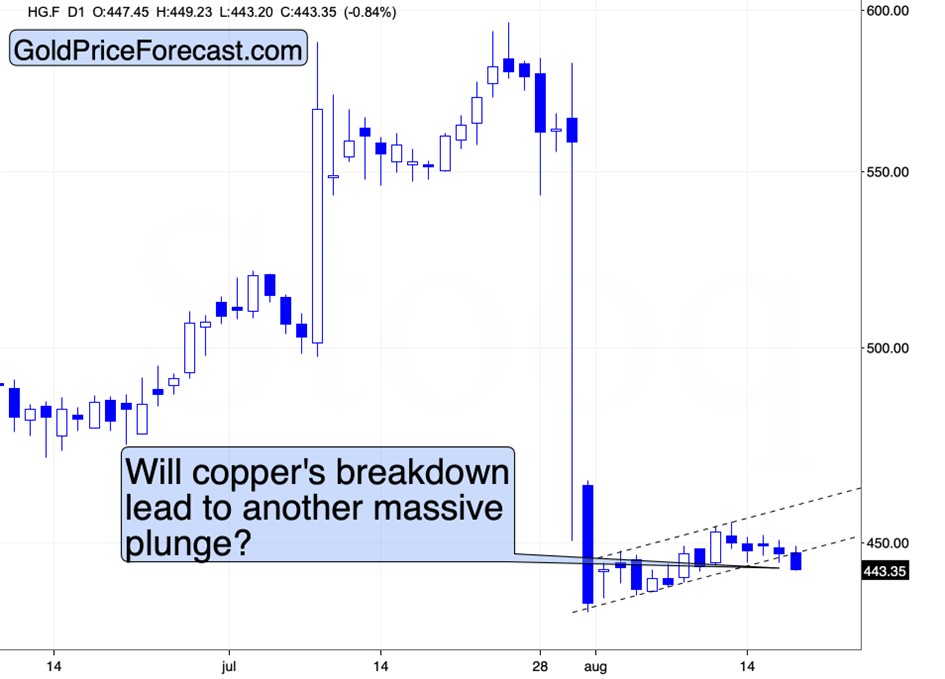
Because this is the breakdown from the flag pattern that was preceded by an enormous short-term slide.
The moves following flag patterns tend to be similar to the moves that preceded it. And the big moves in copper tend to be aligned with big moves in the precious metals market. Yes, the late-July slide was tariff-news-based, so it’s not that odd that gold, silver, and miners shrugged it off, however, if we now see another slide and it’s based on technical reasons (thus, it truly represents market’s emotional state), the odds are that other markets would also be affected.
All in all, it seems that the precious metals market is about to get the spark triggering its decline any day now. Miners are at critical crossroads (and so is the stock market as Inna Rosputnia explains in her recent article) and given the way they performed recently relative to gold (just like at their 2011 top) and given the breakdowns in gold, copper, and platinum, it looks like we won’t have to wait too long.
In other words, my gold price forecast for August 2025 remains bearish.
Thank you for reading today’s analysis – I appreciate that you took the time to dig deeper and that you read the entire piece. If you’d like to get more (and extra details not available to 99% investors), I invite you to stay updated with our free analyses - sign up for our free gold newsletter now.
********
 Przemyslaw Radomski, CFA, is the founder, owner and the main editor of SunshineProfits.com. You can reach Przemyslaw at: http://www.sunshineprofits.com/help/contact-us/.


