Gold & Silver Trading Alert: Strong Rally’s Implications
In short: Opening a speculative short position (half of the regular position) in gold, silver and mining stocks might be a good idea right now.
Yesterday, gold rallied significantly, mining stocks rallied less significantly (didn’t close higher than on Tuesday) and silver moved higher very insignificantly. Let’s see how much changed (charts courtesy of http://stockcharts.com).
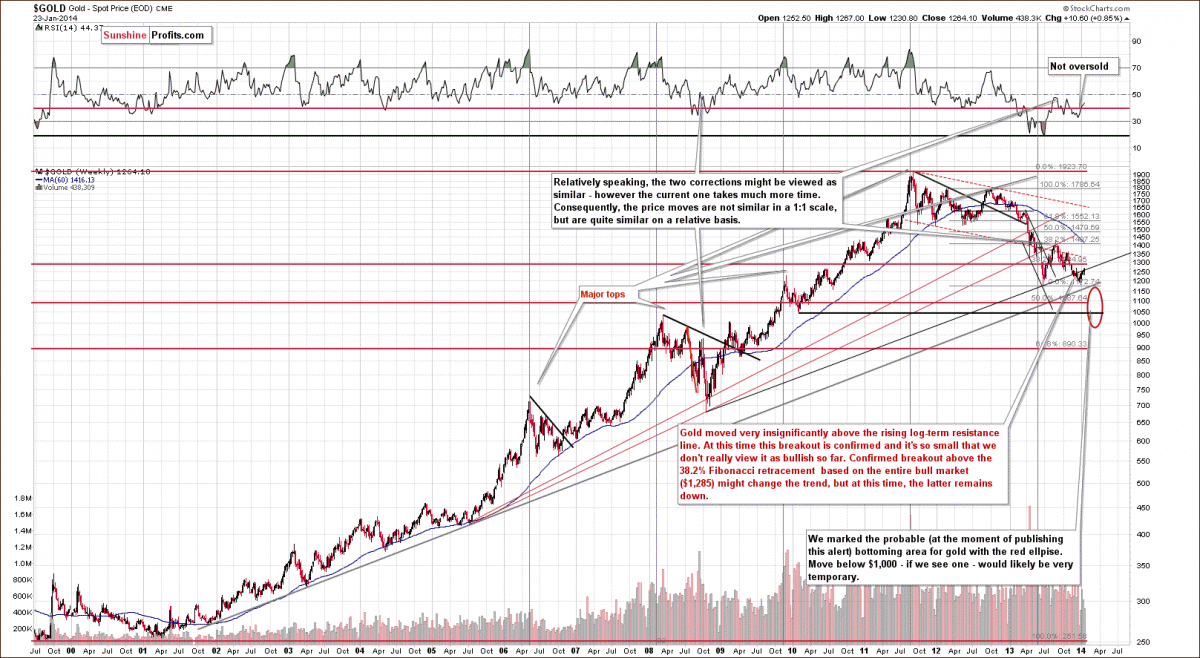
From the long-term perspective, not much changed. The move that we saw on Thursday was significant on a daily basis (as you can see on the chart below), but from the long-term perspective, it didn’t cause significant changes. In fact, there were barely any changes to speak of. Yes, gold closed above the rising long-term support line, but the move above it was so insignificant from this perspective, that it’s not even clear if it really happened. Obviously, we would need to see gold close above this line for at least 2 more trading days, but taking into account the significance of the resistance line discussed, we might need to see something more before we view the breakout as confirmed.
Please note that there is another major resistance quite close to where gold is now. We would still need to see the 38.2% Fibonacci retracement level being taken out (a confirmed breakout) before we can really discuss a change in the medium-term trend, which still remains down.
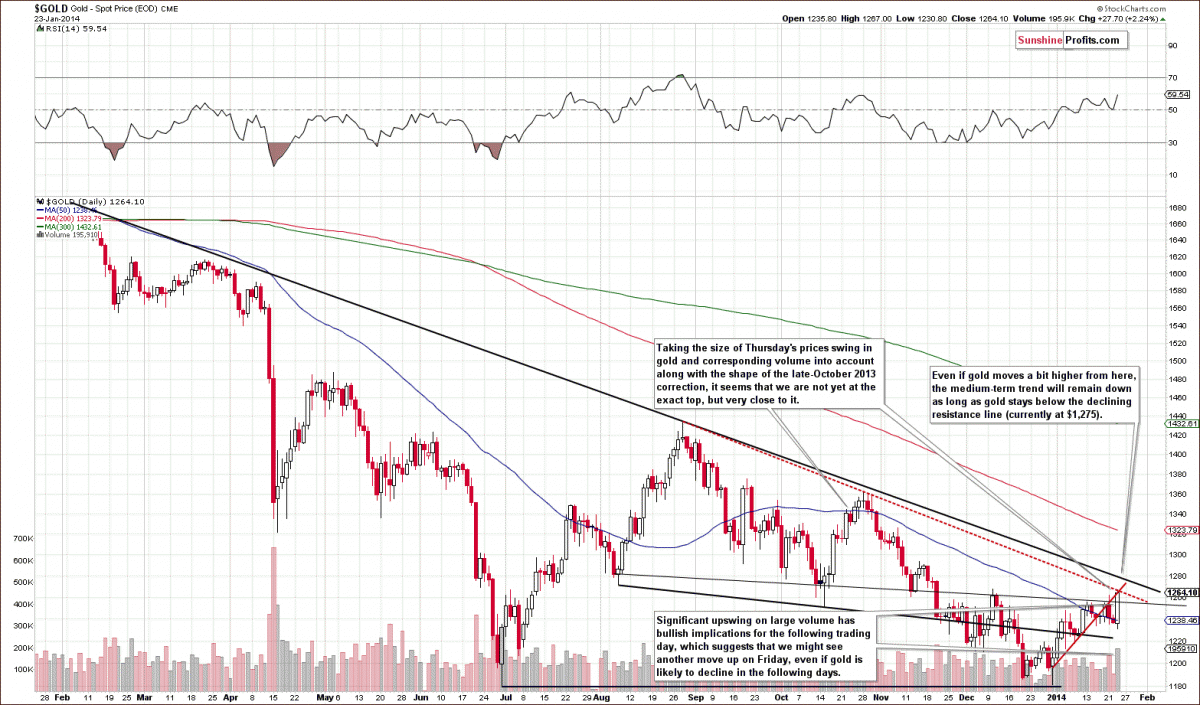
On the above chart, we have a bullish sign – a move above the previous January high that happened on significant volume. Such action is quite likely to be followed by another daily upswing (it doesn’t have to be significant). However, this seems to be the end of positive news.
The move didn’t take gold above the declining medium-term resistance line (black line) and neither did it result in a breakout above the declining short-term resistance line (red, dashed line).
Combining the implications from the two above paragraphs, we get a picture in which gold would be likely to rally on Friday or on one of the following days, but this rally would take gold only to the declining medium-term resistance line (approximately to $1,275) and after that the yellow metal would be likely to decline once again.
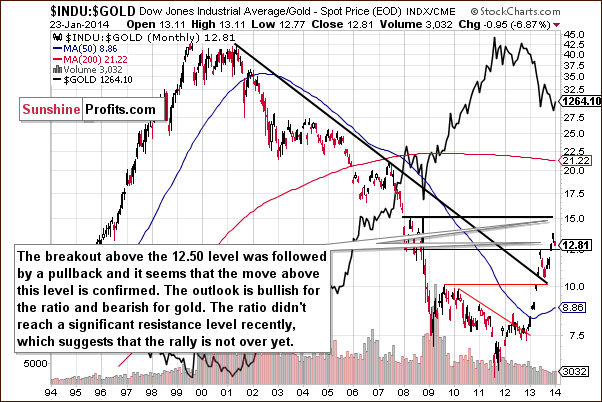
Taking the Dow to gold ratio into account, we see a post-breakout correction. It’s worth noting that the correction has begun sort of “by itself” – without reaching any significant resistance line. This makes it more likely that the move is just a correction and not a real decline in the ratio (meaning a rally in gold).
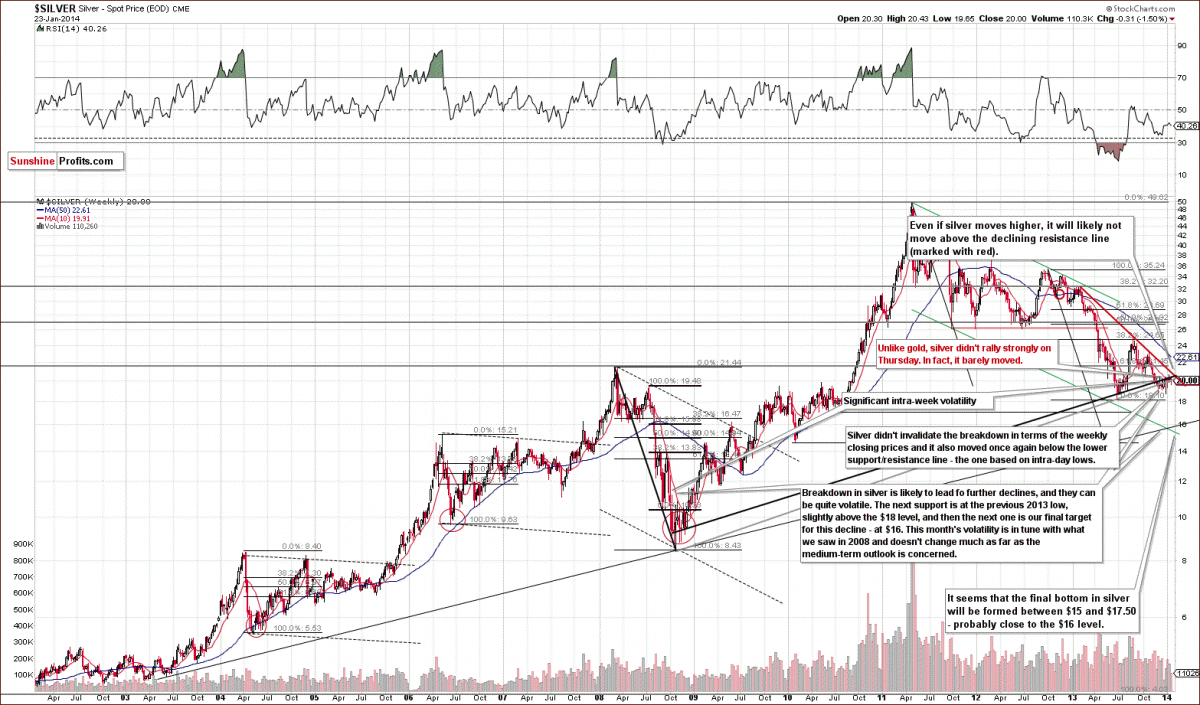
Moving on to the silver chart, we see something much less bullish.
Silver moved significantly lower earlier this week and the situation didn’t really improve yesterday. Silver moved only slightly higher and it is still down $0.31 for the week. The trend clearly remains down as there was no breakout above both rising long-term support/resistance lines.
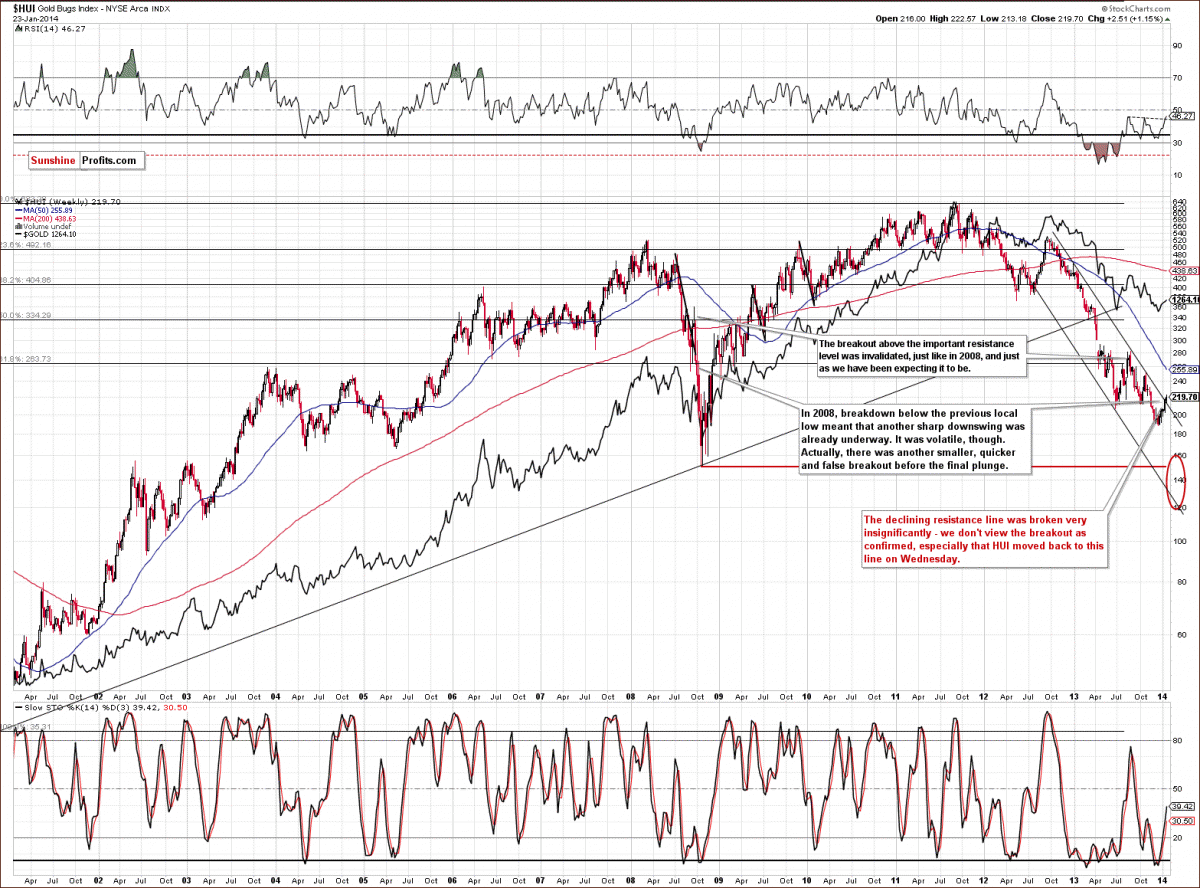
Meanwhile, gold stocks moved higher, but not that significantly.
Gold miners moved higher recently, but not to the extent that would suggest the medium-term trend is already up. Yes, we saw a very small (!) move above the declining resistance line, but just as it was the case with gold, we would need to see a confirmation of this move.
This is particularly the case because we saw something similar right before the final part of the plunge in 2008. History repeats itself to some degree and the current decline is in our opinion most similar to the only other major decline that we saw since the beginning of this bull market. Back then there was one major correction within the decline (we saw one in mid-2013) and then one small one. We have a small breakout right now.
So, how bullish is it, really? „Mildly“ is our best answer at this time.
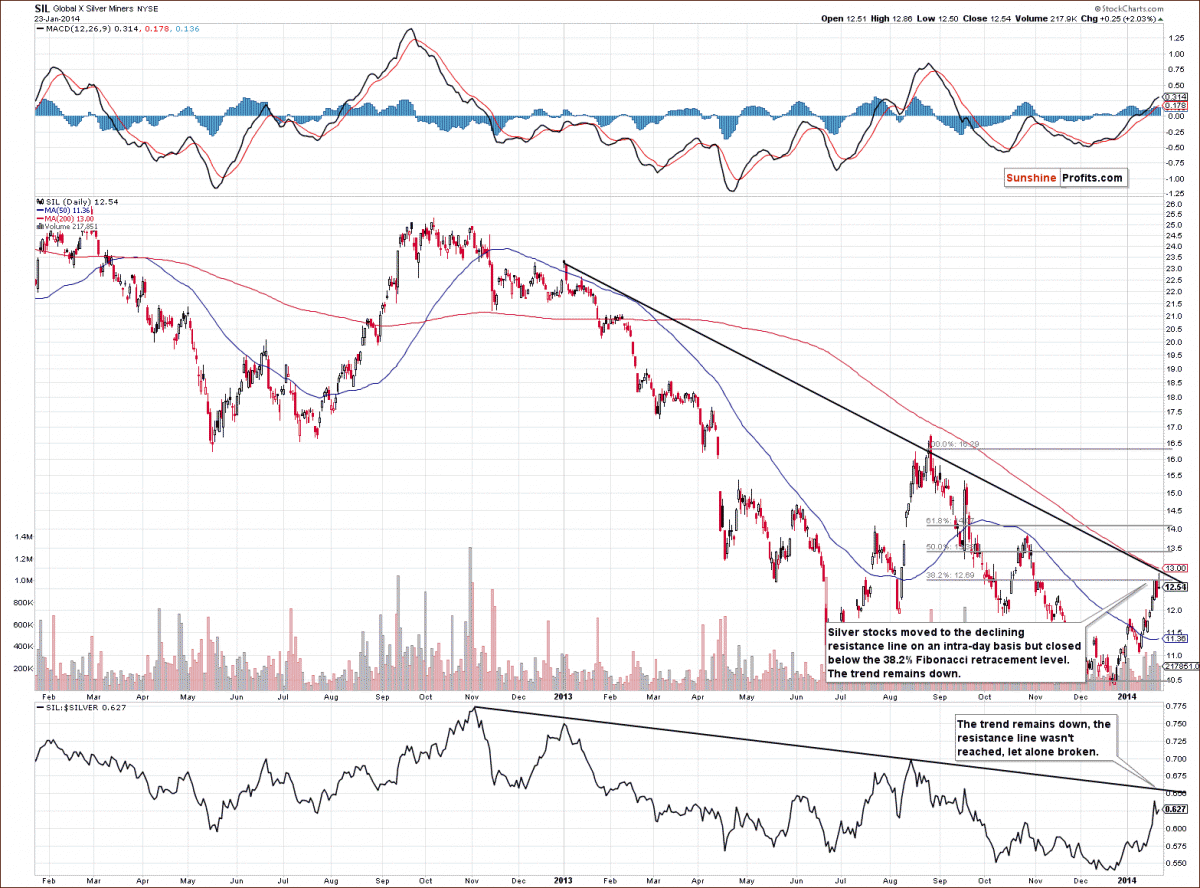
What about silver stocks?
Silver stocks remain in a downtrend.
They corrected to the first of the classic Fibonacci retracement levels, the 38.2% retracement, and declined afterwards (there was an intra-day breakout on Thursday, but the move didn’t hold and silver miners closed below the retracement). This means that the trend remains down and all that what we saw was a correction.
The declining resistance lines (for silver stocks, and for their ratio to silver, which you can see in the lower part of the chart) were not broken and the trend remains down also from this perspective.
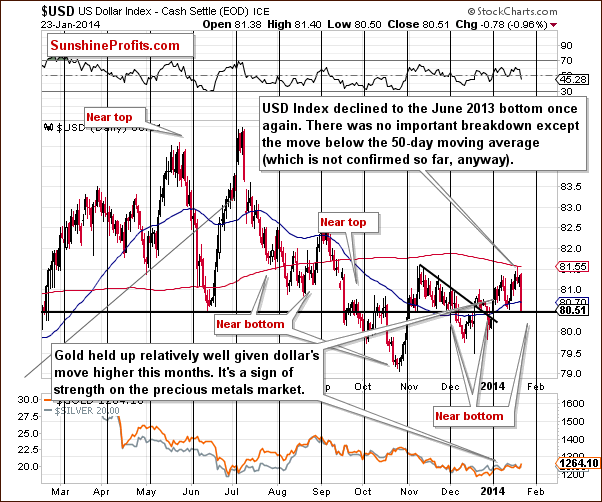
There is no doubt that a significant, counter-trend daily slide in the USD index was one of the factors contributing to higher precious metals prices on Thursday.
The USD Index but declined right to the horizontal support level created by the June 2013 low. The medium- and long-term trends are up, so it’s quite likely that the big surprises will be to the upside – please note that overall it’s been the case since late October 2013. Will the USD Index rally immediately? At this time the situation is unclear, but things may change quite soon.
On a side note, you may wonder how it is possible for the US dollar to be in a long-term uptrend since there is an open-ended QE in place (and the taperie was very small). The reason is that the USD Index is a weighted average of currency exchange rates, and each rate compares USD to another fiat currency. If these other currencies decline faster than the US Dollar (remember the massive money-printing program by the Bank of Japan?), then the USD Index will rally.
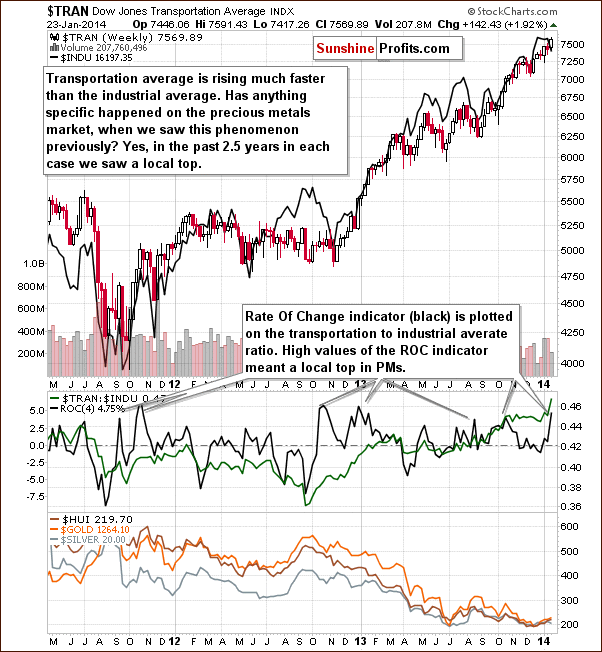
The last, but definitely not the least important chart for today might seem a bit complicated at first, but please take some time to examine it.
The above chart features the Dow Jones Transportation Average and its values relative to the Dow Jones Industrial Average.
The ratio has moved sharply higher recently, which means that while the DJIA didn’t move much higher, the DJTA did. At this point, you may be asking yourself, why should you – a precious metals investor – bother with such ratio. The answer is: because you are probably interested in estimating when a local top in gold, silver and mining stocks is forming, and a sharp rally in the presented ratio has signaled 6 out of 6 times a top materialized since mid-2011.
Of course, 6 cases don’t prove anything, but it seems that there is a quite significant tendency and we should not ignore it. Naturally, not all moves higher in the DJTA to DJIA ratio will have this effect – the above chart suggests that only the most significant moves are that meaningful. Smaller rallies don’t have the same effect (or at least it’s not that strong).
In the middle of the chart you can see the ratio (green line) and the Rate of Change indicator plotted on it – when this indicator is high, the rally is sharp, which is exactly why we used it.
Summing up, taking all of the above into account, based on Thursday’s closing prices we got the same final result we got after analyzing two first charts dedicated to gold. The very short term (the next few days) was still rather unclear with a bullish bias, but the medium term seemed to be still down. However, since gold moved very close to the declining resistance line today and miners declined heavily, it seems that opening small speculative short positions in the sector is justified from the risk/reward perspective.
To summarize:
Trading capital: Short position (half) in gold, silver and mining stocks
Long-term capital: No positions.
********
As always, we'll keep our subscribers updated should our views on the market change. We will continue to send them our Gold & Silver Trading Alerts on each trading day and we will send additional ones whenever appropriate. If you'd like to receive them, please subscribe today.
Thank you.
Sincerely,
Przemyslaw Radomski, CFA
Founder, Editor-in-chief
Tools for Effective Gold & Silver Investments - SunshineProfits.com
Tools für Effektives Gold- und Silber-Investment - SunshineProfits.DE
* * * * *
Disclaimer
All essays, research and information found above represent analyses and opinions of Przemyslaw Radomski, CFA and Sunshine Profits' associates only. As such, it may prove wrong and be a subject to change without notice. Opinions and analyses were based on data available to authors of respective essays at the time of writing. Although the information provided above is based on careful research and sources that are believed to be accurate, Przemyslaw Radomski, CFA and his associates do not guarantee the accuracy or thoroughness of the data or information reported. The opinions published above are neither an offer nor a recommendation to purchase or sell any securities. Mr. Radomski is not a Registered Securities Advisor. By reading Przemyslaw Radomski's, CFA reports you fully agree that he will not be held responsible or liable for any decisions you make regarding any information provided in these reports. Investing, trading and speculation in any financial markets may involve high risk of loss. Przemyslaw Radomski, CFA, Sunshine Profits' employees and affiliates as well as members of their families may have a short or long position in any securities, including those mentioned in any of the reports or essays, and may make additional purchases and/or sales of those securities without notice.


 Przemyslaw Radomski,


