Gold, Silver, Yen And S&P500 Correlation


Last week Craig Hemke (aka Turd Ferguson at tfmetalsreport.com) published an interesting and intelligent article about the post 2011 relationship between the Yen, Gold, and the S&P500. Some quotes from his article:
“…the price of gold is now largely determined solely by fluctuations in the yen.”
“So, if you’re baffled why ‘fundamentals don’t seem to matter’, it’s because fundamentals don’t matter. There are very few human traders of size left and the computers control everything. In this environment, arcane notions such as supply/demand and company fundamentals are insignificant. The primary driver to these ‘markets’ are changes to the USDJPY. Control that and you control everything else.”
In other words:
- HF Traders sell the yen, it goes down, gold goes down.
- If the dollar goes up causing the yen to go down, gold goes down.
- If the Fed talks the dollar up, gold goes down.
Further:
- HF Traders sell the yen and it goes down, the S&P500 goes up (for the last 4 years).
- So yen down, dollar up, and S&P500 up. Wall Street is happy.
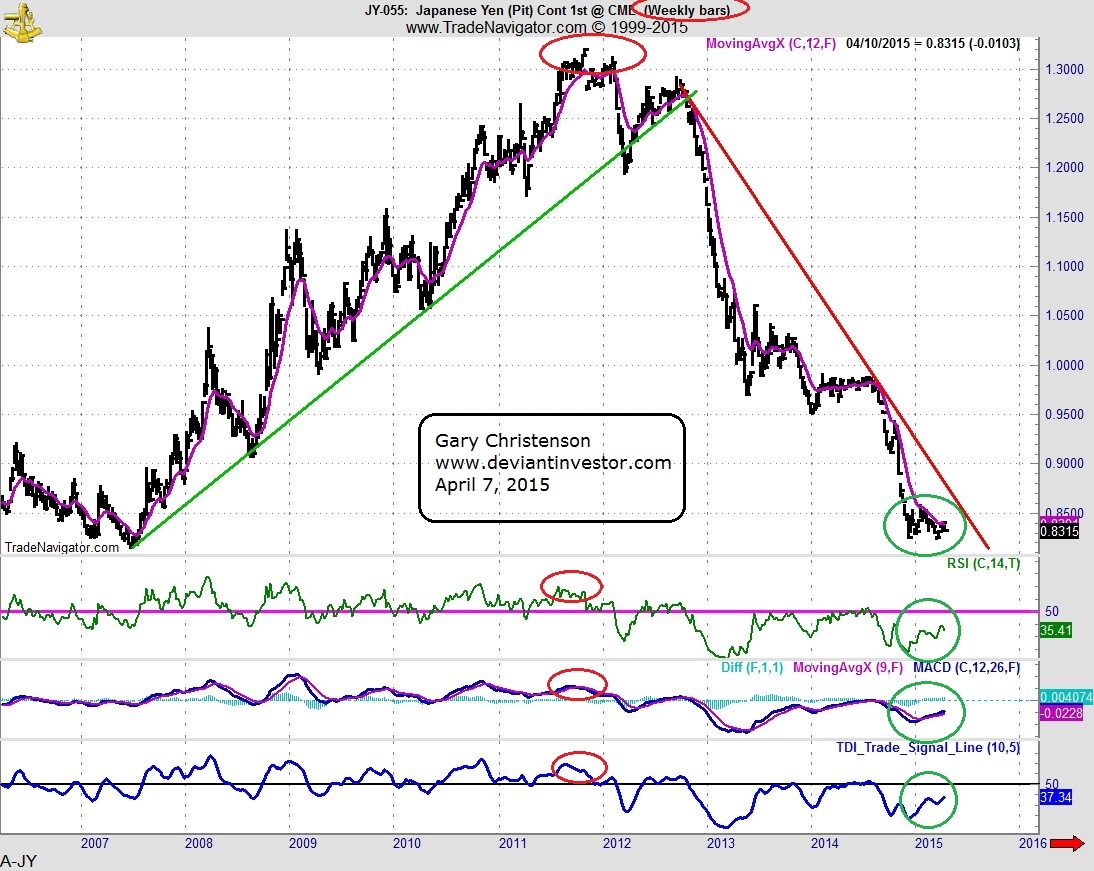
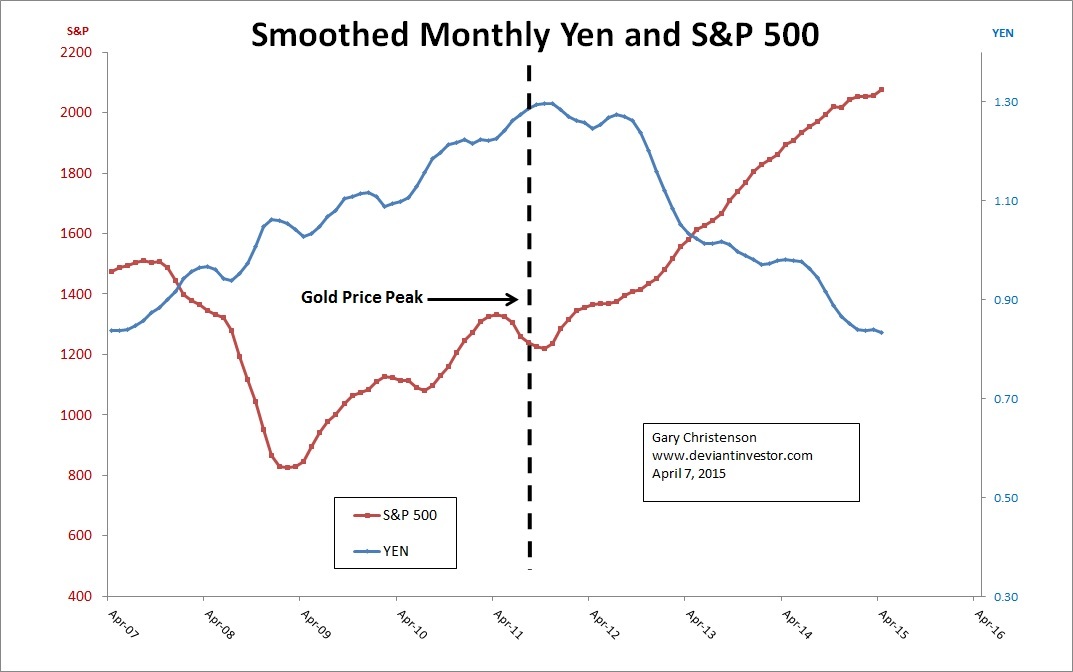
Look at the charts of weekly yen (yen per penny) and smoothed monthly yen, gold, and the S&P 500 to confirm the above correlations.
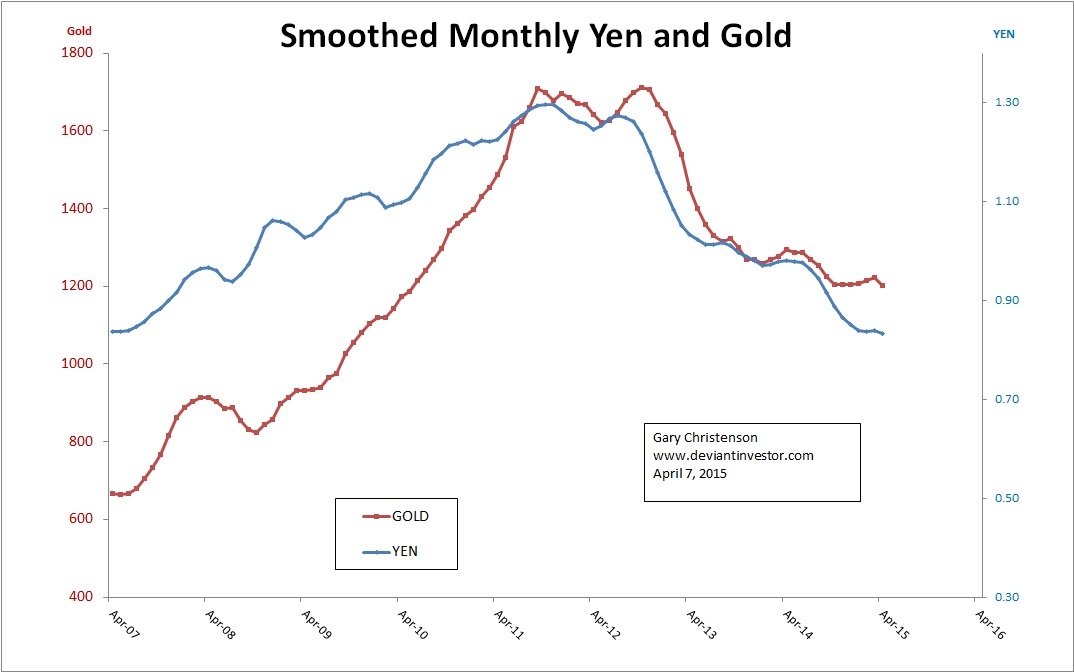
As you can see the smoothed graphs of monthly yen and monthly gold are similar. Over the last 8 years of gold prices rallying and crashing, the statistical correlation has been about 0.74. Since the all-time high in gold prices in August 2011, the yen-gold correlation has been an astonishing 0.96.
Similarly, the smoothed graph of monthly yen and monthly S&P500 shows an inverse correlation. Yen down, S&P500 up, and Wall Street, the Fed, and the Bank of Japan are happy. The statistical correlation over the same 8 year period has been about negative 0.49. Since the all-time high in gold prices in August 2011, the yen-S&P correlation has been a negative 0.97.
It is the same story with silver. The correlation between smoothed silver and smoothed yen over 8 years has been about 0.80 and about 0.97 since August 2011.
The amazing correlations subsequent to the August 2011 all-time high in gold are rather suspicious, and certainly support Craig Hemke’s analysis. I think the central banks watched gold hit an all-time high of nearly $2000 per ounce and they retaliated. The High Frequency Traders and other “insiders” heavily shorted gold and the yen and bought the S&P. It has almost been a “one-way” trade since then. It is amazing that the yen, gold, silver, and the inverse S&P500 have been so tightly correlated (over 0.95) for almost four years…
Mr. Hemke’s conclusion is:
“anyone worried about a renewed drop in gold should only be concerned with two things:
- Can the Bullion Banks find a steady supply of readily-deliverable gold at prices below $1,150?…
- Is the yen going to make even deeper lows?”
Whether or not you believe that computer driven “algo” trading controls the paper gold, yen, silver and S&P markets, the correlations are stunning. If you have another theory, we would like to hear it.
In the meantime, T-Bonds had an unusual 3+ Sigma rise in March, the dollar and the S&P may have peaked, and gold and silver are stronger. It looks to me like the dollar, T-Bonds, and the S&P have rolled over, or will turn down soon. By implication, gold and silver should rally.
However, you can easily find analysis from large banks that suggests gold prices will remain flat or fall for several more years. We have heard it before and they will probably make the same bearish comments for the next decade. Other analysts, such as Larry Edelson have published comments. He said:
“No way has gold bottomed…there is no major support until the $900 level, which is where I expect gold to bottom.”
I DISAGREE. We shall see.
When High Frequency Traders, central banks, and political agendas are in control, the price of paper gold can be suppressed and bonds can be levitated. The real questions are:
How much longer can the HF Traders and central banks manage the paper markets to the detriment of the real market for physical gold?
When will Asian demand overwhelm the western paper markets?
Note: My empirical model for long-term gold prices indicates a “fair” price for gold of $1,527 for 2015 and much higher in subsequent years.
********
The Deviant Investor
 Gary Christenson is the owner and writer for the popular and contrarian investment site Deviant Investor and the author of the book, “Gold Value and Gold Prices 1971 – 2021.” He is a retired accountant and business manager with 30 years of experience studying markets, investing, and trading. He writes about investing, gold, silver, the economy and central banking.


